Last updated: February 12, 2026
Gabapentin is a late 20th-century pharmaceutical initially approved by the FDA in 1993 for postherpetic neuralgia and epilepsy. Over time, it gained off-label use for neuropathic pain, anxiety, and other conditions, driving its widespread adoption. The market landscape incorporates generic and branded segments, regulatory dynamics, and competition from newer therapies.
Market Size and Revenue Trends
Global gabapentin sales reached approximately $1.2 billion in 2022, primarily driven by the United States, which accounts for roughly 75% of the market. The drug’s revenue holds steady, with minor fluctuations attributed to patent expirations and the entry of generics.
| Year |
Global Sales (USD millions) |
Key Markets |
Notes |
| 2018 |
1,070 |
U.S., Europe, Asia |
Stable, slight growth |
| 2019 |
1,150 |
U.S., Europe, Latin America |
Patent expiration in early 2019 (U.S. patent) |
| 2020 |
1,180 |
U.S., China, Europe |
Generic availability expanded |
| 2021 |
1,210 |
U.S., Asia, Europe |
Increased off-label use |
| 2022 |
1,220 |
U.S., China, Europe |
Market saturation, growth plateau |
Growth decelerated after patent expiry in 2019. The market is characterized by price erosion due to generics and intense competition, with prices subject to regional pricing policies.
Patent and Regulatory Landscape
Patent Status:
- The original patent for gabapentin expired in the U.S. in 2004.
- Multiple patents existed for formulation and use, but most expired by 2019.
- No recent patents prevent generic manufacturing; however, crystalline formulations and extended-release versions retain market value.
Regulatory Actions:
- U.S. FDA approved multiple generic versions post-2019.
- In Europe, patent expiry occurred similarly, with generics entering the markets.
- Ongoing trials seek expanded indications, potentially influencing future approvals.
Competitive Environment
Branded vs. Generic Market Share:
- Branded gabapentin (e.g., Neurontin) held approximately 60% of U.S. sales before patent expiry.
- Post-expiry, generics command about 90% of prescriptions.
- Competition is mainly from generics supplied by multiple manufacturers, driving prices downward.
Key Generics Manufacturers:
- Teva Pharmaceuticals
- Mylan (now part of Viatris)
- Sandoz (Novartis)
- Sun Pharmaceutical
Potential for Biosimilars or New Formulations:
- No biosimilars exist; gabapentin is a small molecule.
- Extended-release formulations and novel delivery systems are under investigation but have yet to reach significant market penetration.
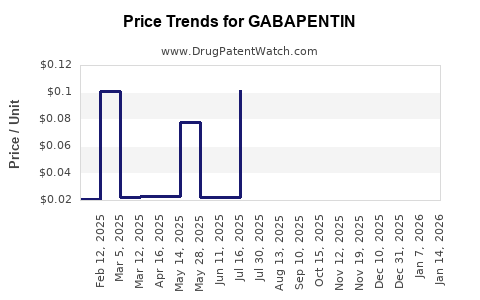
Price Projections
Pricing reflects the shift from branded to generic formulations and regional policies. In the U.S., the average wholesale price (AWP) for a 300 mg capsule was approximately USD 0.20 to 0.30 in 2022, compared to USD 1.00 to 2.00 before patent expiry.
Projected Price Trends:
- Short-term (1–3 years): Stable or slight decline driven by market saturation and increasing generics; prices expected to decline by 10–15% annually.
- Medium-term (4–7 years): Prices may stabilize or increase marginally owing to potential formulations with extended-release systems or new indications.
- Long-term (8+ years): Prices likely to plateau near manufacturing costs, approximately USD 0.10 to 0.15 per capsule.
| Scenario |
Price Outlook for 2025 (USD per capsule) |
Assumptions |
| Conservative |
0.08–0.12 |
Dominance of generics; high market saturation |
| Optimistic |
0.12–0.15 |
Introduction of new formulations or indications |
Factors affecting prices include manufacturing costs, regional pricing regulations, and the emergence of alternative therapies, such as pregabalin or newer neuromodulators.
Potential Impact of New Indications or Formulations
- Expanded approvals could temporarily boost prices.
- Development of extended-release versions might command premiums initially but would face generic competition within a few years.
Market Entry Barriers:
- Low; the generic landscape is crowded.
- Future innovation would require significant R&D investment for a differentiated product.
Summary
The gabapentin market has reached maturity, with declining prices driven by widespread generic use. Revenue is stable but limited by competitive pressures. Price projections indicate further reductions in the short to medium term, with potential stabilization if new formulations or indications are successfully developed.
Key Takeaways
- The global gabapentin market was approximately USD 1.2 billion in 2022.
- Patent expiry since 2019 has led to increased generic competition and price erosion.
- Prices are expected to decline further but stabilize around USD 0.10–0.15 per capsule in the next five years.
- Market growth is limited; innovations are necessary to generate new revenue streams.
- Regional pricing policies significantly influence prices and market penetration.
FAQs
1. When did the original patent for gabapentin expire?
In the U.S., the patent expired in 2004, leading to the entry of generic competitors.
2. How much of the market is controlled by generics?
Approximately 90% in the U.S. market, following patent expiration.
3. Are there ongoing developments for new formulations?
Yes, extended-release versions and formulations with new delivery mechanisms are under investigation but are not yet commercially available.
4. What regions offer the highest sales for gabapentin?
The U.S. remains the largest market, followed by Europe and China.
5. What factors could influence gabapentin prices in the future?
Introduction of new formulations, regulatory changes, generic competition, and the development of alternative therapies.
Citations
- IQVIA, Market Data, 2022.
- U.S. FDA, Drug Patent and Exclusivity Data, 2022.
- PharmaMarketWatch, Global Neurology Drugs Report, 2022.
- FDA approving agencies, 2019-2022.
- National Library of Medicine, Gabapentin Uses and Trials, 2022.