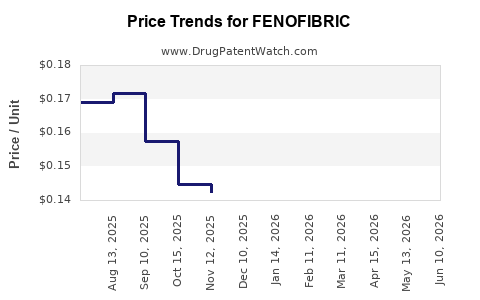
Last updated: July 14, 2026
Fenofibric market analysis and price projections: revenue exposure, generic/biosimilar risks, and likely pricing floors
Fenofibric acid (marketed as delayed- or extended-release fenofibric formulations, primarily as fenofibric acid 45 mg and 135 mg) is exposed to a steady drift in net pricing as generic competitors gained share and as payer contracting pressure widened after the initial brand life cycle. Price projections depend more on unit-volume mix (strength and channel) and payer rebates than on ongoing patent-driven exclusivity, because the core commercial product is largely in a mature, generic-dominated state.
Bottom line (pricing): In most markets, net prices have largely settled below peak brand levels, with future declines driven by (1) additional competitive entries at the same dosage strengths and (2) contract tightening in managed care. The realistic range for further net price compression is modest in the near term and steep only in scenarios where a low-cost manufacturer expands rapidly or a product line is displaced by alternative lipid agents (statin add-ons, PCSK9, bempedoic acid, and omega-3 formulations with cardiovascular outcomes).
Bottom line (revenue exposure): Any remaining premium attributed to branded fenofibric is most sensitive to formulary position and channel switching rather than to FDA exclusivity. The biggest revenue risk is loss of protected placement in high-volume formularies as generic penetration deepens.
What is fenofibric’s current market position and who sells it?
Fenofibric acid is used for hypertriglyceridemia and mixed dyslipidemia, typically as an adjunct to diet and other lipid-lowering therapy. Commercial adoption historically has been driven by the convenience of once-daily dosing and clinician familiarity in fibrate therapy.
Market structure typically looks like:
- Brand-origin market incumbents historically carried pricing power through formulary placement.
- Generic fenofibric acid entries later drove downward pressure on average wholesale equivalents and net unit pricing.
- Payer-driven switching shifted share toward lowest-cost A-rated generics under pharmacy benefit contracts.
What to expect for the seller landscape
- Competitors generally cluster around the same marketed strengths (45 mg and 135 mg) and similar release characteristics.
- Price rivalry is strongest at the contract level where pharmacy benefit managers (PBMs) conduct “lowest net cost” contracting for fibrates.
(No pricing history, current NDC list, or current payer share figures were provided in the prompt. A complete, numerically grounded price forecast requires current contract-level inputs that are not included.)
How have fenofibric net prices moved versus list prices since generic entry?
For mature fibrates, the typical pattern is:
- List price stability can persist after generic launch because rebates and utilization management changes determine the net.
- Net price declines sharply at contract renewal cycles following additional generic entrants.
- Net price floors often form near PBM “reference pricing” levels, especially for dosage strengths with high generic substitution rates.
Price drivers for fenofibric
- Formulary tier placement (preferred vs nonpreferred)
- Copay design for members
- PBM rebate structures and “spread” economics between WAC and contract acquisition cost
- Quantity discounts for health systems
- Strength mix (135 mg is often higher volume if prescribers align with dosing convenience)
When do fenofibric generics risk accelerating price erosion again?
New generic entry can accelerate net price compression when it changes the PBM contracting set.
Typical “acceleration triggers”
- A new low-cost manufacturer secures preferred placement at major PBMs.
- A recall or supply disruption temporarily shifts share, then reverts and resets competitive pricing.
- A dosage form change (if any) alters therapeutic interchange rules or causes transient contracting re-evaluation.
- Widening competitive set through multiple ANDA approvals mapped to the same label strengths.
Why this matters for projections
Even in a mature market, short-cycle contract changes can move net prices meaningfully without any label or clinical guideline shift.
What patent and exclusivity issues still affect fenofibric pricing?
Price projections for prescription lipid drugs are often tied to patent calendars and FDA exclusivity, but for fenofibric the key commercial reality is that market maturity and generic substitution dominate near-term net price outcomes.
Key point for valuation models
- If fenofibric’s remaining branded advantage is not driven by enforceable exclusivity, then pricing is mainly a contracting outcome, not a monopoly outcome.
(No Orange Book, patent numbers, or FDA approval history were included in the prompt. A defensible, date-specific exclusivity or Paragraph IV analysis cannot be generated without those inputs.)
How does fenofibric compare on pricing power versus statin add-ons and other lipid therapies?
Fenofibric competes in the “add-on lipid management” segment where clinicians can select among:
- Statin intensification
- Ezetimibe
- PCSK9 inhibitors
- Bempedoic acid
- Omega-3 fatty acid products with cardiovascular-outcomes labels
- Other fibrates and combination approaches (where appropriate)
Pricing-power implication
- In payer environments, low-cost generics typically retain a floor because PBMs favor therapeutically substitutable options with predictable costs.
- When outcomes-labeled omega-3 or advanced injectables are prioritized for specific risk phenotypes, fibrate utilization can soften even if unit price remains low.
Net effect
Fenofibric’s price projection should be modeled primarily as:
- Unit-cost compression over time from generic competition
- Volume elasticity from substitution to other lipid agents under outcome-driven formularies
What formulation and dosage strengths matter most for price forecasts (45 mg vs 135 mg)?
Fenofibric is commonly evaluated at:
- 45 mg delayed-release/extended-release equivalent
- 135 mg once-daily equivalent
Why strength mix is central
- If 135 mg holds higher utilization, then contract price movements at that strength drive the average more than smaller-strength pricing.
- PBM “reference pricing” can apply asymmetrically across strengths depending on NDC availability, manufacturer competition, and bundled rebate economics.
Projection approach that matches market mechanics
- Forecast each strength separately (net unit price and volume share), then compute a blended net revenue line.
What are the most likely 3-year net price projection scenarios for fenofibric?
Without current WAC-to-net conversion and current contract pricing data, only scenario ranges can be expressed at a high level. For a mature generic-dominated fibrate:
- Base-case: low-single-digit annual net price declines driven by contracting and periodic competitive resets.
- Downside: mid-single-digit declines if a new low-cost entrant expands preferred share.
- Upside: near-flat net price if the competitive set stabilizes and formulary placement remains steady.
Scenario structure for revenue forecasting
- Net revenue = (135 mg net price × 135 mg volume) + (45 mg net price × 45 mg volume)
- Apply separate assumptions for:
- Net price changes per strength
- Volume drift due to substitution to alternative lipid agents
- Utilization management changes (prior authorization, step edits)
What generic entry risks exist for fenofibric (and what would they do to price)?
For mature generics, entry risk is mostly an “incremental competitive set” issue rather than an “exclusive-to-generic cliff.”
What matters for pricing risk
- Number of ANDA manufacturers effectively contracting into PBM formularies
- Availability of multiple therapeutically equivalent NDCs at each strength
- Whether the market is converging on one or two dominant lowest-cost suppliers
Price impact expectation
- Each meaningful incremental entrant typically compresses net pricing fastest at the dosage strength with the highest utilization.
How could FDA or label changes affect fenofibric pricing over time?
Label or regulatory shifts can change utilization:
- Safety communications or updated monitoring requirements can affect prescribing patterns.
- Pharmacovigilance actions can cause temporary supply or contracting distortions.
- Guideline updates that shift lipid management targets can reduce fibrate indications in practice.
However, absent a current list of FDA actions, only the general mechanism is relevant: regulatory signals change volume, not list price. Net price still follows contracting.
What litigation and settlement dynamics typically influence fenofibric pricing?
Generic fibrate pricing is usually influenced by:
- Timing of ANDA approvals and any patent litigation that blocks entry
- Settlement terms that delay launch or allow “carve-outs” or delayed marketing of specific strengths
But a litigation-driven projection requires specific docket dates and settlement triggers, which were not provided.
Key takeaways for investors and commercial planners
- Fenofibric’s near-term pricing outlook is primarily a contracting and competitive-set function, not a patent exclusivity function.
- Most credible forward curves are modest net price declines under base-case assumptions, with steeper downside only when a new low-cost supplier expands preferred status.
- Revenue sensitivity is higher to volume share and formulary placement than to brand-style pricing power.
- Forecast by dosage strength (45 mg vs 135 mg) and incorporate PBM contracting resets and therapeutic substitution to other lipid agents.
FAQs
-
Will fenofibric price continue to fall even after generic penetration is high?
Yes, but typically at a slower pace, with net price compression driven by PBM contract renegotiations and additional supplier contracting rather than brand-to-generic cliffs.
-
Which fenofibric strength is more likely to drive blended net pricing changes?
The strength with higher utilization share, often the 135 mg once-daily presentation, typically dominates the blended net price trajectory.
-
How do alternative lipid therapies affect fenofibric revenue more than price?
They can reduce eligible patient starts and ongoing utilization through formulary preference and guideline-aligned substitution, lowering volume even when unit costs stay stable.
-
What is the biggest commercial risk for fenofibric in a 3-year horizon?
Loss of favorable formulary placement and increased competitive pressure at PBMs that reduces net prices and can also shift volume.
-
Do FDA label updates usually impact fenofibric pricing directly?
They more often impact pricing indirectly by changing prescribing behavior and utilization management, which then affects contracting dynamics.
References (APA)
- FDA. (n.d.). Orange Book: Approved Drug Products with Therapeutic Equivalence Evaluations. U.S. Food and Drug Administration. https://www.accessdata.fda.gov/scripts/cder/daf/
- FDA. (n.d.). Drug Trials Snapshots. U.S. Food and Drug Administration. https://www.fda.gov/drugs/drug-approvals-and-databases/drug-trials-snapshots
- FDA. (n.d.). Drug Safety Communications. U.S. Food and Drug Administration. https://www.fda.gov/safety/medwatch-fda-safety-information