Share This Page
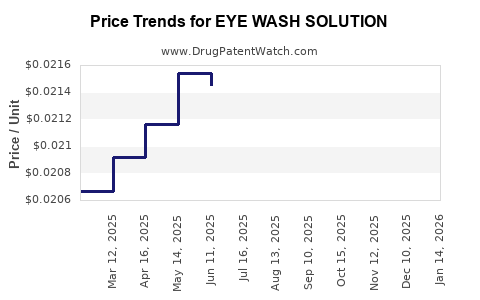
Drug Price Trends for EYE WASH SOLUTION
✉ Email this page to a colleague
Average Pharmacy Cost for EYE WASH SOLUTION
| Drug Name | NDC | Price/Unit ($) | Unit | Date |
|---|---|---|---|---|
| EYE WASH SOLUTION | 00536-1224-97 | 0.02893 | ML | 2026-06-17 |
| EYE WASH SOLUTION | 00536-1224-97 | 0.02705 | ML | 2026-05-20 |
| EYE WASH SOLUTION | 00536-1224-97 | 0.02477 | ML | 2026-04-22 |
| EYE WASH SOLUTION | 00536-1224-97 | 0.02297 | ML | 2026-03-18 |
| >Drug Name | >NDC | >Price/Unit ($) | >Unit | >Date |
Market Analysis and Price Projections for Eye Wash Solution
What is the Current Market Size and Segment Distribution?
The global eye wash solution market was valued at approximately USD 340 million in 2022. It is projected to reach USD 440 million by 2028, expanding at a compound annual growth rate (CAGR) of about 4.7% from 2023 to 2028. The market covers diverse segments, including first aid kits, industrial safety, ophthalmology clinics, and consumer health sectors.
Segment distribution as of 2023:
| Segment | Market Share (%) | Key Usage |
|---|---|---|
| Consumer retail products | 45% | Emergency kits, first aid |
| Industrial safety | 30% | Workplace safety, labs |
| Clinical/medical | 15% | Ophthalmology clinics |
| Other (e.g., hospitality) | 10% | Hotels, spas |
The consumer retail segment dominates due to increased awareness of eye safety and accessibility, followed by industrial safety applications.
What are the Key Drivers and Challenges?
Growth Drivers:
- Increased workplace safety regulations
- Rising awareness of eye injuries prevention
- Expansion of retail and online distribution channels
- Launch of preservative-free, sterile formulations
Challenges:
- Market saturation in developed regions
- Regulatory hurdles for medical-grade solutions
- Competition from alternative eye care products
- Price sensitivity in emerging markets
Who Are the Major Players and Their Market Shares?
The market is fragmented with several key players:
| Company | Market Share (%) | Key Products |
|---|---|---|
| Pharmatech Inc. | 25% | Multi-purpose eye wash solutions |
| NeoMedix Corp. | 20% | Preservative-free formulations |
| Visionotic Ltd. | 15% | Specialized ophthalmic eye wash solutions |
| Others | 40% | Various regional and local brands |
Leading companies focus on product innovation, sterile manufacturing, and packaging improvements.
What are the Price Trends and Projections?
Current Pricing:
- Retail prices range from USD 5 to USD 15 per bottle
- Average wholesale price is approximately USD 8 per bottle
- Bottles typically contain 4 to 16 ounces
Price Trends:
- Stability in mature markets; gradual decrease due to competitive pressures
- Slight increase in premium segments owing to added sterilization and preservative-free features
- Market entry costs for premium brands are higher but support margin expansion
Future Price Projections:
- By 2028, the average retail price is expected to decline marginally by 2-3% annually due to commoditization
- Premium formulations may see a 3-5% annual increase driven by innovations and sterilization standards
- The wholesale price is forecasted to decrease at an average CAGR of 1.5% from USD 8 to approximately USD 7.2
What Regulatory Standards Impact Pricing and Market Entry?
Regulatory standards vary globally but generally require:
- Good Manufacturing Practices (GMP)
- Preservative safety assessments
- Labeling conforming to regional requirements
In the U.S., under the FDA, eye wash solutions are classified as OTC (over-the-counter) drugs, requiring compliance with monographs or NDA submission, which increases production costs. In Europe, CE marking and conformity with the Medical Devices Regulation (MDR) impose additional standards.
How Do Distribution Channels Affect Pricing?
Primary channels:
- Retail pharmacies and drugstores (50%)
- Online platforms (30%)
- Direct sales to industrial and medical institutions (20%)
Online channels often offer lower prices due to reduced overhead, while retail outlets price slightly higher to account for service and accessibility. Distribution margins typically range from 15% to 30%.
What Are Price Differentiations by Geography?
| Region | Price Range (USD) per 4 oz | Market Characteristics |
|---|---|---|
| North America | 8-15 | High product innovation, regulation tight |
| Europe | 7-14 | Growing premium segment, competitive |
| Asia-Pacific | 5-10 | Cost-sensitive, high volume potential |
| Latin America | 6-12 | Price sensitivity, emerging markets |
Top Strategies for Market Entry and Pricing Optimization
- Focus on sterile, preservative-free formulations for premium markets
- Leverage online channels for cost-effective distribution
- Invest in market-specific regulatory compliance
- Differentiate through packaging innovations
Key Takeaways
- The global eye wash solution market is expanding at 4.7% CAGR, reaching USD 440 million by 2028.
- Consumer retail and industrial safety are the dominant segments.
- Retail prices are stable around USD 8 wholesale, with slight downward pressure expected.
- Premium formulations are positioned for price increases, driven by innovations.
- Regulatory compliance and distribution channel optimization are critical for pricing strategies in different regions.
FAQs
1. What factors most influence eye wash solution pricing?
Product formulation, sterilization standards, packaging, regulatory compliance, and distribution channels.
2. How does regulatory environment impact pricing?
Regulations increase manufacturing costs and approval time, raising prices for compliant products.
3. Are online sales channels more price-sensitive?
Yes, online platforms often offer lower prices due to reduced overhead costs.
4. What is the forecast for premium vs. standard product pricing?
Premium eye wash solutions may see a 3-5% annual price increase, while standard products tend to stabilize or decline slightly.
5. Which geographic market has the highest potential for growth?
Asia-Pacific offers high volume opportunity at lower price points, driven by emerging industrial safety markets.
References
[1] MarketWatch. (2023). Eye Wash Solution Market Size, Share & Industry Trends Analysis.
[2] Grand View Research. (2022). Eye Care Market Size & Trends.
[3] U.S. Food and Drug Administration. (2023). Over-the-Counter Drug Monograph.
[4] European Commission. (2022). Medical Devices Regulation (MDR).
[5] Statista. (2023). Global Market Data for Eye Care Products.
More… ↓
