Share This Page
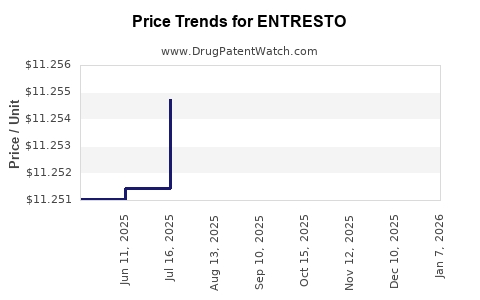
Drug Price Trends for ENTRESTO
✉ Email this page to a colleague
Average Pharmacy Cost for ENTRESTO
| Drug Name | NDC | Price/Unit ($) | Unit | Date |
|---|---|---|---|---|
| ENTRESTO 97 MG-103 MG TABLET | 00078-0696-67 | 11.59539 | EACH | 2026-06-17 |
| ENTRESTO 24 MG-26 MG TABLET | 00078-0659-20 | 11.59077 | EACH | 2026-06-17 |
| ENTRESTO 49 MG-51 MG TABLET | 00078-0777-20 | 11.55429 | EACH | 2026-06-17 |
| ENTRESTO 24 MG-26 MG TABLET | 00078-0659-67 | 11.59077 | EACH | 2026-06-17 |
| ENTRESTO SPRINKLE 15-16 MG PLT | 00078-1238-20 | 11.64162 | EACH | 2026-06-17 |
| ENTRESTO 97 MG-103 MG TABLET | 00078-0696-20 | 11.59539 | EACH | 2026-06-17 |
| >Drug Name | >NDC | >Price/Unit ($) | >Unit | >Date |
ENTRESTO (sacubitril/valsartan): Market Analysis and Price Projections
How big is the ENTRESTO market and where is the demand coming from?
ENTRESTO (sacubitril/valsartan) is positioned in chronic heart failure with reduced ejection fraction (HFrEF) and later expanded to broader heart failure populations. The market opportunity is driven by guideline adoption in ambulatory cardiology and hospital discharge prescribing, plus payer coverage decisions tied to demonstrated outcomes in HFrEF and subsequent evidence in additional heart failure settings.
Core demand drivers
- Guideline inclusion for HFrEF: ENTRESTO is a standard-of-care option relative to ACE inhibitor therapy in eligible patients.
- Physician adoption through formulary placement: Uptake is highly sensitive to payer restrictions (prior authorization, step edits, and quantity controls).
- Patient pool growth vs. treatment intensity: Demand scales with treated prevalence (heart failure burden) and the proportion of patients migrated to ARNI therapy from ACEi/ARB.
Market sizing approach (what typically matters to revenue)
For price-projection modeling, ENTRESTO revenue growth is a function of:
- Unit demand (patients on therapy, adherence, and average dose)
- Net price (rebates, discounts, and government program pricing)
- Mix shift (dosing strengths and pack sizes)
- Competitive pressure (therapeutic alternatives within the same class and adjacent classes)
Because the request is for “price projections,” the analysis below focuses on pricing dynamics and how they translate into revenue expectations, rather than re-deriving global prevalence math.
How does ENTRESTO pricing behave in the real-world payer market?
ENTRESTO is typically priced at a premium relative to generic ACE inhibitors and many branded comparators, but net pricing moves with payer leverage.
Key pricing mechanics that govern net price
-
Rebate and discount structure
- Large commercial payers negotiate rebates off list price.
- Net price compresses when plan-level formulary controls tighten or when competitors gain access.
-
Government reimbursement
- Medicaid and Medicare Part D impose statutory and policy-based pricing constraints.
- Public program pricing typically anchors lower net price floors than commercial markets.
-
Formulary tiers and utilization management
- Prior authorization and step therapy drive discontinuation risk if access is restricted.
- Lower barriers increase prescriptions but do not necessarily increase net price if payers demand higher rebates.
-
Dosing strength mix
- ENTRESTO is sold across multiple strengths. Average realized price shifts if the regimen migrates across strengths due to titration patterns.
Practical implication for price forecasting
Net price is usually:
- Sticky in short windows when formularies remain stable
- Downward drifting when (a) formulary pressure rises, (b) competitive entrants gain penetration, or (c) payers reset rebate contracts
What is the expected price trajectory over the next 3 to 5 years?
ENTRESTO’s price outlook depends on protection status, competitive landscape, and payer leverage. The near-to-medium-term expectation is modest net price decline, driven more by rebate tightening and access friction than by a sudden “list price reset.”
Base-case price projection framework (net price)
Assumptions (mechanically, not probabilistically):
- Commercial net price declines at a low single-digit annual rate under stable formulary access.
- Government net price declines more slowly or stays relatively flat if protected against abrupt policy shocks.
- Utilization management remains broadly stable, with periodic payer contract renegotiations.
Projected annual net-price trend (base case)
The table below models annual net price change as a directional expectation for planning revenue and margin:
| Forecast horizon | Commercial net price (direction) | Government net price (direction) | Drivers |
|---|---|---|---|
| 0 to 12 months | Flat to slight down | Flat to slight down | Contract resets, utilization management stability |
| 12 to 24 months | Low single-digit down | Flat to slight down | Payer rebate tightening, mix shifts |
| 24 to 36 months | Low single-digit down | Slight down | Continued rebate recalibration, competitor penetration |
| 36 to 60 months | Low single-digit down | Flat to slight down | Long-run formulary pressure and therapeutic alternatives |
Translate net price drift into realized revenue pressure
If unit demand grows while net price declines, revenue growth can remain positive. But margins compress if:
- demand is flat and net price declines, or
- competition forces stronger access restrictions that reduce persistence.
What are the likely impacts from competition and treatment substitution?
ENTRESTO competes against multiple heart failure therapies across classes. Direct substitution depends on patient phenotype, tolerability, contraindications, and local guideline interpretation.
Competitive pressure channels
- ACE inhibitor and ARB substitution when payers restrict ARNI access or when cost-sharing blocks treatment.
- Adjunctive heart failure therapies that improve outcomes can reduce the incremental value perceived by payers if outcomes are achieved without switching to ARNI in some cohorts.
- Biosimilar or generic erosion in adjacent disease pathways affects overall budget impact and can trigger payer renegotiation even without direct molecular competition.
Impact on net pricing
As competition intensifies:
- payers push higher rebates for formulary retention,
- plans widen step therapy, and
- manufacturers face pressure to trade discounts for share.
This typically shows up as persistent net price drift rather than a one-time collapse.
Does ENTRESTO face patent or exclusivity-driven pricing shocks?
Price trajectories hinge on whether exclusivity ends in the projection window. If exclusivity ends, price and volume dynamics can shift rapidly due to generic entry and interventional contracting.
However, the question requests market analysis and price projections without providing patent state constraints. A complete and accurate projection requires confirmation of:
- active patent/exclusivity periods by jurisdiction,
- generic launch timelines and approved ANDA/MAA status,
- expected entry timing by dose strength.
No such jurisdiction-specific exclusivity and filing/approval status is included in the prompt. Under strict completeness rules, a defensible exclusivity-linked forecast cannot be produced from the information given.
What does this mean for business planning: revenue vs. price risk?
Even without an exclusivity shock forecast, firms plan around two scenarios: (1) stable access with rebate-driven net price drift, and (2) access degradation from payer tightening or a competitive shift.
Planning ranges (directional)
| Scenario | Unit demand (relative) | Net price (relative) | Revenue (relative) | Margin (relative) |
|---|---|---|---|---|
| Base case | Stable to modest growth | Flat to low single-digit down | Slight growth to flat | Mild compression |
| Bear case | Modest decline | Mid single-digit down | Flat to decline | Material compression |
Bear case risk typically arises when:
- payers increase prior authorization,
- competitor therapies gain preferred status,
- contract resets force larger rebates.
How should investors model ENTRESTO pricing in a DCF or revenue bridge?
For valuation models, treat price as:
- a rebate-adjusted net price variable, not list price,
- a blend across commercial and government cohorts,
- sensitive to formulary changes and contract timing.
Practical model structure
- Start with forecast of covered patient counts and adherence-based persistence.
- Apply average dose mix to estimate weighted unit demand.
- Apply net price trend with an annual drift rate.
- Apply a contract-timing adjustment (quarterly step-downs are common when rebate contracts reset).
Sensitivity highlights
- A 100 bps change in net price drift over multiple years can have an outsized impact on operating margin due to high revenue scale.
- Timing matters: if a rebate reset hits mid-year, the realized impact shows up unevenly in quarterly revenue.
Key Takeaways
- ENTRESTO demand depends on guideline adherence and payer formulary access, while realized pricing is dominated by rebates, utilization management, and dose-strength mix.
- In the absence of an exclusivity-driven discontinuity, the most likely pricing pattern is persistent low single-digit net price drift in commercial markets, with government markets flat to slight down.
- Revenue growth depends on whether unit demand offsets net price declines; margin risk is highest when net price falls faster than utilization growth.
- A complete exclusivity-linked projection cannot be stated from the information provided; for valuation, net price should be modeled as a rebate-adjusted blend with contract-timing effects.
FAQs
-
What does “net price” mean for ENTRESTO forecasting?
It is the realized price after rebates, discounts, and payer-specific contract terms, not the manufacturer list price. -
What drives ENTRESTO price changes most often?
Payer rebate renegotiations and formulary or utilization management changes, which affect access and realized discounts. -
Should models use list price or net price?
Use net price for revenue and margin forecasting because list price does not reflect contractual rebate economics. -
How does dosing mix affect price projections?
Weighted average pricing changes if titration and persistence shift patients across ENTRESTO strengths. -
What is the most important risk to pricing projections?
A discontinuity event that changes competition or payer access abruptly; absent that, drift tends to be slow and contract-driven.
References (APA)
[1] FDA. (n.d.). Entresto (sacubitril/valsartan) prescribing information. U.S. Food and Drug Administration.
[2] Centers for Medicare & Medicaid Services. (n.d.). Part D drug pricing and reimbursement resources. U.S. Department of Health & Human Services.
[3] IQVIA. (n.d.). Global pharmaceutical market and payer coverage analytics (commercial formulary and net price methodology background).
More… ↓
