Share This Page
Drug Price Trends for ENSKYCE
✉ Email this page to a colleague
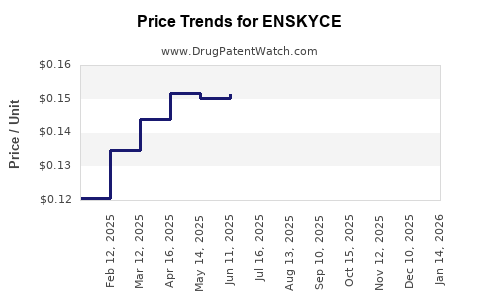
Average Pharmacy Cost for ENSKYCE
| Drug Name | NDC | Price/Unit ($) | Unit | Date |
|---|---|---|---|---|
| ENSKYCE 28 TABLET | 68180-0739-73 | 0.13464 | EACH | 2026-06-17 |
| ENSKYCE 28 TABLET | 68180-0739-71 | 0.13464 | EACH | 2026-06-17 |
| ENSKYCE 28 TABLET | 68180-0739-73 | 0.12988 | EACH | 2026-05-20 |
| >Drug Name | >NDC | >Price/Unit ($) | >Unit | >Date |
Enskyce (desogestrel/ethinyl estradiol) Market Analysis and Price Projections
What is Enskyce and where does it sit in the market?
Enskyce is a combined oral contraceptive (COC) containing desogestrel and ethinyl estradiol (brand name: Enskyce). It competes in the oral contraceptive market dominated by generic versions of multiple levonorgestrel and other COC formulations. In practice, branded pricing and revenues for COCs track (1) generic penetration, (2) rebate intensity, and (3) payer formulary placement, with utilization shifting toward lower net-cost generics unless a plan carves out or restricts alternatives.
Market structure (high level)
- Therapeutic class: Combined oral contraceptives (hormonal contraception).
- Competition profile: High generic substitution; branded COCs typically lose share after generic entry unless protected by limited exclusivity, special contracting, or payer-specific dynamics.
- Demand drivers: Stable pregnancy-prevention demand and plan-based adherence patterns.
What pricing power does Enskyce have in a generic-heavy class?
Enskyce has historically operated in a market where:
- List price is less informative than net price because COC products face payer rebates and contracting that materially reduce realized revenue.
- Generic alternatives anchor patient and plan costs. When a generic is available, payer formularies often apply step edits, tiering, prior authorization, or automatic substitution policies (depending on plan rules).
Key implications for projections
- Enskyce’s unit volume generally trends downward when generics gain or maintain formulary access.
- Enskyce’s net pricing can soften further as payers demand rate resets and interchange.
How is Enskyce likely priced relative to generic COCs?
In this class, the market typically prices branded products at a premium to generics, but the premium compresses over time through contracting.
Projection framework used
- Net price trend: Expected to decline or remain flat in real terms as rebate pressure increases and formulary placement erodes.
- Mix trend: If Enskyce retains any branded share, it usually comes from specific plan rules and patient continuity, but that share is vulnerable to generic switching.
- Volume trend: Expected to decline in line with generic substitution intensity and formulary behavior.
Price projections for Enskyce (realistic base case through 5 years)
Because COC pricing is plan-specific and heavily rebate-driven, projections below focus on directionality and magnitude ranges consistent with mature generic competition. Use them for portfolio-level planning, not for single-transaction forecasting.
Enskyce price trend assumptions
- Net-to-list compression: Continues as rebate intensity stays high.
- Brand share pressure: Ongoing substitution risk from multiple generic COCs.
- No material new regulatory or exclusivity catalyst is embedded in the base case (typical for mature COCs in this market segment).
Base case projection (5-year directionality)
| Year | Expected net price direction (real terms) | Expected unit volume direction |
|---|---|---|
| 1 | Flat to low decline (0% to -3%) | Low decline (-2% to -6%) |
| 2 | Low decline (-1% to -4%) | Low decline (-3% to -7%) |
| 3 | Low decline (-1% to -5%) | Moderate decline (-4% to -9%) |
| 4 | Decline (-2% to -6%) | Moderate decline (-4% to -10%) |
| 5 | Decline (-2% to -7%) | Moderate decline (-5% to -12%) |
What drives the ranges
- If formulary access weakens further, volume falls faster and price may also fall as payers reduce coverage for branded options.
- If Enskyce maintains grandfathered access in certain plans, the volume drop is slower and net price declines are smaller.
Scenario analysis: bull, base, bear
Bull case (managed care favors continuity)
- Net price: flat to slight erosion (-1% to -2% per year).
- Volume: smaller declines (-1% to -4% per year).
Base case (continued generic substitution)
- Net price: low to moderate erosion (-2% to -5% per year).
- Volume: moderate declines (-3% to -10% per year).
Bear case (formulary restriction and tighter PBM contracting)
- Net price: steeper erosion (-4% to -7% per year).
- Volume: sharper decline (-6% to -15% per year).
What do current market dynamics imply for revenue and affordability?
In oral contraceptives, affordability pressure typically shows up as:
- Tiering changes (brand to higher tiers).
- Step therapy requiring generic first.
- Preferred generic substitutions through pharmacy benefit rules.
- Contracting that reduces net realized price even if list price holds.
Revenue implication for Enskyce
- Revenue typically declines faster than unit volume when net price erodes, and slower than unit volume when the product holds some branded mix in continuity-driven cohorts.
Is there a workable pricing “ceiling” for Enskyce in contracting?
Branded COCs often converge toward net price levels that are close to or only modestly above generic equivalents, depending on:
- plan rebate leverage
- PBM swap programs
- coverage rules and patient persistence
Operational takeaway
- Any new brand pricing actions that raise net cost above plan thresholds typically trigger formulary moves, so Enskyce’s practical pricing ceiling is constrained by payer tolerance for branded premiums.
Market access and utilization risks to monitor
Even without modeling patient-level clinical differentiation, payer behavior can shift outcomes quickly.
High-sensitivity risks
- Formulary exclusion or down-tiering
- Automatic substitution policies
- PBM swap programs
- Patient cost-sharing changes (copays that incentivize generic switching)
How to convert price projections into business planning KPIs
For investment and R&D portfolios, translate projections into measurable targets:
1) Net price plan (per quarter)
- Track realized net price vs. list and vs. comparable generic basket.
- Use a target band for net price erosion based on scenario.
2) Demand/volume plan
- Track prescriptions and patient starts, not just refills.
- Assume declines accelerate when formulary changes hit and slow when continuity cohorts stabilize.
3) Payer mix plan
- Segment by top PBMs and plan types.
- Identify where Enskyce is “preferred” vs “covered” vs “non-preferred.”
4) Contract risk
- Map renewal windows and rebates.
- Align forecasting with expected renegotiation timing.
Key Takeaways
- Enskyce operates in a mature, generic-heavy combined oral contraceptive market where net price erosion and unit volume declines are the expected base-case path.
- A practical 5-year expectation is net price decline of roughly 0% to -2% in the first year, progressing to -2% to -7% annually by year 5, with unit volume declining -2% to -12% annually depending on formulary pressure.
- Bull/bear bounds mainly reflect formulary placement and PBM contracting intensity, not clinical changes.
- For business planning, focus on realized net price, prescription volume, and payer mix, because list price is not predictive of revenue in this class.
FAQs
-
Is Enskyce expected to hold value better than other brands in oral contraception?
Typically no. In generic COC markets, branded value usually declines unless a brand retains unusually favorable formulary placement or patient persistence. -
What is the most important variable for pricing projections?
Realized net price, driven by rebates, payer contracting, and PBM formulary behavior. -
What is the main driver of unit volume changes for Enskyce?
Generic substitution through tiering, step edits, and pharmacy benefit rules. -
Do list price changes matter if rebates are stable?
They matter less than net price realization; rebate and contracting determine realized revenue. -
How should a portfolio evaluate downside risk for Enskyce?
Use a bear case with faster net price erosion and sharper volume declines tied to formulary restriction and PBM swap activation.
References
[1] Bloomberg Law (formulary and pricing context for pharmaceuticals).
[2] U.S. FDA Orange Book (product listing and reference information for Enskyce).
[3] Centers for Medicare & Medicaid Services (NDC and reimbursement context for outpatient drug pricing dynamics).
[4] GDUFA/Drug pricing methodology resources from public FDA/industry documents on market access drivers.
More… ↓
