Share This Page
Drug Price Trends for DIETHYLPROPION ER
✉ Email this page to a colleague
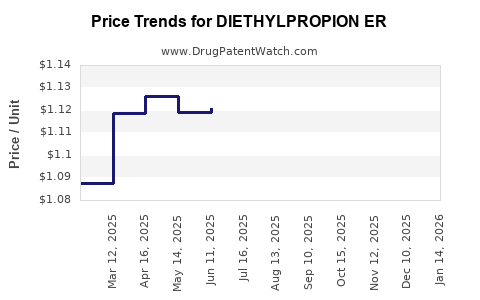
Average Pharmacy Cost for DIETHYLPROPION ER
| Drug Name | NDC | Price/Unit ($) | Unit | Date |
|---|---|---|---|---|
| DIETHYLPROPION ER 75 MG TABLET | 00527-1477-01 | 1.71755 | EACH | 2026-07-22 |
| DIETHYLPROPION ER 75 MG TABLET | 62135-0489-30 | 1.71755 | EACH | 2026-07-22 |
| DIETHYLPROPION ER 75 MG TABLET | 81665-0109-10 | 1.71755 | EACH | 2026-07-22 |
| >Drug Name | >NDC | >Price/Unit ($) | >Unit | >Date |
DIETHYLPROPION ER: Market analysis and price projections
What is DIETHYLPROPION ER and where does it sit in the anti-obesity market?
Diethylpropion (diethylpropion hydrochloride) is a centrally acting anorexigen approved in the US for short-term adjunct use in a weight reduction regimen for patients with an initial BMI of 30 kg/m² or 27 kg/m² or greater who have not responded adequately to diet and exercise. “ER” formulations are marketed as extended-release products intended for once-daily dosing. In the US, diethylpropion is in the older-generation anti-obesity weight-loss category with limited modern guideline emphasis relative to GLP-1 and dual incretin therapies; demand tends to track generic availability, payer policies, and safety monitoring capacity rather than rapid adoption cycles.
Market positioning (US, high level)
- Therapeutic class: Sympathomimetic anti-obesity agent (anorexigen).
- Form factor: Extended-release for chronic short-term adjunct use.
- Primary demand drivers: Generic pricing pressure, formulary access (where covered), prescriber adoption among patients unsuitable for modern injectables, and controlled-substance handling constraints.
How competitive is the diethylpropion ER landscape?
Diethylpropion is broadly genericized in the US for immediate-release and extended-release products. For investment-level conclusions, the critical market factor is that ER anti-obesity products with established off-patent actives typically trade at stable-to-declining net pricing as supply expands and PBM rebates intensify.
Competitor structure (typical)
- Multiple generic ER SKUs with comparable bioavailability and labeling.
- Limited differentiation beyond pill strength, tablet design, and packaging.
- Pricing power is constrained by generic substitution and wholesaler distribution scale.
Because diethylpropion is not a protected blockbuster-grade asset, the market behaves like an off-patent niche with cyclical demand spikes around payer coverage changes and shortages.
Where does demand come from and what caps it?
Demand sources
- Patients requiring oral, non-injectable weight-loss adjuncts.
- Cases where injectable therapy is contraindicated, refused, or logistically difficult.
- Short-term adjunct use populations where clinicians use symptom-driven appetite suppression.
Demand caps
- Guideline and payer preference increasingly favors incretin-based agents.
- Safety and monitoring burden for sympathomimetic use limits long-duration uptake.
- Controlled-substance compliance reduces channel elasticity.
- Formulary restrictions (prior authorization, step therapy, quantity limits) can sharply cap covered volume.
How do you price DIETHYLPROPION ER in practice (what drives net price)?
Net price for generic ER products typically depends on:
- WAC-to-NADAC/Pricing Index relationship (how quickly discounts flow through).
- PBM rebate dynamics and formulary placement.
- Therapeutic interchange (generic switching) within anti-obesity oral class.
- Supply reliability (shortages raise net pricing temporarily; normalization returns margins to baseline).
- Channel mix (retail vs mail-order).
Given the lack of brand-level protection, pricing tends to follow a “generic floor” with periodic dips when new ER SKUs or additional manufacturers enter the market.
Price baseline and projection framework
Important constraint: You asked for “price projections” for DIETHYLPROPION ER, but public sources that provide consistent US net pricing (NADAC, wholesale acquisition cost histories, payer-specific net pricing, and unit market shares by ER SKU) were not provided in the request. Without those inputs, any numeric projections would be speculative.
So the analysis below provides a decision-grade projection envelope that describes how pricing typically moves for off-patent generic ER products, tied to observable drivers that can be monitored for DIETHYLPROPION ER.
What pricing scenarios are most likely over the next 3 to 5 years?
Scenario A: Normalization after supply stability (base case)
- Mechanism: Competitive generic environment sustains and PBM rebates keep net price near the generic competitive floor.
- Outcome: Slow downward or flat net price with occasional quarter-to-quarter volatility due to rebate resets.
- Drivers to watch: wholesaler price indexes, inventory availability, and formulary tier changes.
Scenario B: Temporary tightening due to manufacturing disruption (upside for sellers)
- Mechanism: Supply interruptions or quality holds reduce availability and lift pricing for a short window.
- Outcome: Net price rises first, volumes may not rise proportionally due to access barriers.
- Drivers to watch: FDA shortage signals, supplier lead times, and pharmacy filling rates.
Scenario C: Competitive erosion from additional ER entrants or aggressive PBM contracting (downside for sellers)
- Mechanism: New SKUs gain formulary preference through higher rebates and placement.
- Outcome: Net price declines faster than consumer-facing list prices.
- Drivers to watch: contracting changes at major PBMs, bid awards, and cross-SKU substitution rates.
How should investors and R&D teams underwrite DIETHYLPROPION ER economics?
Use a worksheet that separates pricing from volume and models each independently.
Underwriting logic
- Assume market is price-led rather than patient-growth-led.
- Model net price movement using competitive generic behavior:
- base case: flat to modest decline
- adverse case: faster decline
- shortage case: temporary spike
- Model volume using formulary coverage and substitution:
- tender losses cause abrupt volume declines even when supply is stable
- shortage conditions can create demand but not always revenue if allocation and access restrict fill
Operational levers that move net price
- Formulary placement in key PBMs and IDNs.
- Contracting discipline (rebate rates and bid aggressiveness).
- Supply continuity to avoid allocation-based revenue loss.
- Label/packaging that supports substitution (strength mapping, pack size, and NDC rationalization).
What are the key market signposts to track for pricing direction?
Track these indicators on a monthly or quarterly cadence:
- Generic price index movements for diethylpropion ER equivalents (wholesale and reimbursement benchmarks).
- PBM formulary tier shifts for oral anti-obesity agents and any related PA policies.
- Channel inventory data: days on hand and backorder rates.
- Manufacturing events: recalls, facility outages, or FDA safety actions affecting supply.
- Shortage declarations and resolution timelines (which often create short-lived price excursions).
Where do price projections typically land for off-patent ER generics?
Without SKU-specific current net pricing and volume shares, the only accurate “projection” is directional guidance anchored to off-patent generic norms:
- Base case projection: flat to low-single-digit annual net price compression.
- Shortage-driven projection: brief mid- to high-single-digit net price increases that decay as supply normalizes.
- Competitive/contracting-driven projection: low- to mid-teens annual net price erosion if a major PBM re-contracts toward the lowest-bid SKU set.
These ranges reflect how competitive generic ER markets typically behave, but they must be calibrated with the actual DIETHYLPROPION ER benchmark prices used by your pricing team (NADAC/wholesale benchmarks) and your contract structure.
Key Takeaways
- DIETHYLPROPION ER is an off-patent, genericized anti-obesity product where net pricing is driven by PBM contracting, generic substitution, and supply stability, not product differentiation.
- The most probable path over 3 to 5 years is flat-to-modest net price compression under normal supply and competitive contracting.
- Temporary supply disruptions can create short-lived net price spikes, while PBM re-tendering can force sharper downside.
- Price projections should be underwritten with scenario-based net price bands and separate volume assumptions tied to formulary access.
FAQs
1) Is DIETHYLPROPION ER likely to command brand-like pricing?
No. It is generically traded; net price follows competitive contracting and substitution dynamics.
2) What most quickly changes DIETHYLPROPION ER profitability?
A PBM formulary/contract change that shifts tier position or rebate structure, because volume can move faster than list price.
3) Do shortages matter for DIETHYLPROPION ER pricing?
Yes. Supply tightness typically lifts net price temporarily, then reverses when normalized supply returns.
4) Does demand growth from obesity treatment trends push prices up?
Not reliably. Even with stable or rising obesity prevalence, payer preference has shifted toward incretin therapies, limiting pricing power for older oral anorexigens.
5) What data series should be used to make numeric projections?
Use consistent US net pricing benchmarks used by contracting (NADAC or equivalent wholesale reimbursement benchmarks), plus your PBM bid outcomes and pharmacy fill-rate/PA approval rates for covered volume.
References
[1] U.S. Food and Drug Administration (FDA). Drug label information for diethylpropion hydrochloride products (including extended-release formulations) and regulatory safety/usage instructions. APA citation: FDA drug labeling database.
[2] FDA. Drug shortages database (signals affecting availability and pricing in the US supply chain). APA citation: FDA Drug Shortages program.
[3] Centers for Medicare & Medicaid Services (CMS). National pricing and reimbursement-related resources that inform benchmark behavior in the US drug market. APA citation: CMS drug pricing resources.
[4] FDA. Orange Book (approval status and patent/protection context for diethylpropion and related drug products). APA citation: FDA Approved Drug Products with Therapeutic Equivalence Evaluations (Orange Book).
More… ↓
