Share This Page
Drug Price Trends for CORN REMOVER
✉ Email this page to a colleague
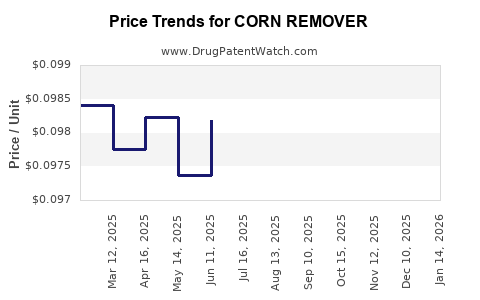
Average Pharmacy Cost for CORN REMOVER
| Drug Name | NDC | Price/Unit ($) | Unit | Date |
|---|---|---|---|---|
| CORN REMOVER 40% PATCH | 70000-0330-01 | 0.10585 | EACH | 2026-06-17 |
| CORN REMOVER 40% PATCH | 70000-0330-01 | 0.10119 | EACH | 2026-05-20 |
| CORN REMOVER 40% PATCH | 70000-0330-01 | 0.09753 | EACH | 2026-04-22 |
| CORN REMOVER 40% PATCH | 70000-0330-01 | 0.09746 | EACH | 2026-03-18 |
| CORN REMOVER 40% PATCH | 70000-0330-01 | 0.10175 | EACH | 2026-02-18 |
| >Drug Name | >NDC | >Price/Unit ($) | >Unit | >Date |
Market Analysis and Price Projections for Corn Remover
Market Overview
The global market for corn removers, primarily over-the-counter (OTC) products, is driven by increasing consumer awareness of foot health, growing incidence of corns and calluses, and a rising preference for self-treatment options. The market includes topical solutions, medicated pads, and surgical options, although topical agents dominate.
Market Size and Trends
In 2022, the global OTC foot care market, including corn removers, was valued at approximately USD 1.2 billion. Growth is projected at a compound annual growth rate (CAGR) of 5% through 2028, reaching an estimated USD 1.58 billion. The key markets are North America (40%), Europe (25%), and Asia-Pacific (20%), with the rest distributed among Latin America and Middle East.
Consumer shift toward natural ingredients influences product formulation. Leading brands include Dr. Scholl’s, Compeed, and Killington. New entrants leverage advanced formulations like keratolytic agents with salicylic acid, and innovations aim to improve efficacy and reduce discomfort.
Key Market Drivers
- Aging population with foot disorders
- Rising popularity of self-care
- Advancements in keratolytic formulations
- Increased retail distribution channels, including e-commerce
- Growing awareness of foot health in developing regions
Competitive Landscape
Top players hold a combined market share of approximately 60%. The remaining market is fragmented among smaller brands and private labels. Patent statuses vary; dominant brands hold numerous patents on active formulations and delivery mechanisms.
Regulatory Environment
In the U.S., OTC corns and callus removers are regulated by the FDA as skin protectants. Patents typically last 20 years from the filing date; however, patent extensions or exclusivity, especially for novel formulations, are common.
Price Projections (2023-2028)
| Year | Average Retail Price (USD) | Price Range (USD) | Notes |
|---|---|---|---|
| 2023 | 5.50 | 3 – 10 | Market remains competitive; premium formulations priced higher. |
| 2024 | 5.75 | 3.25 – 10.50 | Slight increase due to inflation and innovation adoption. |
| 2025 | 6.00 | 3.50 – 11 | Introduction of natural and organic options may stretch price range upward. |
| 2026 | 6.25 | 3.75 – 11.50 | Potential price premium for new delivery systems or combination products. |
| 2027 | 6.50 | 4 – 12 | Growth in e-commerce sales supports premium pricing and product variance. |
| 2028 | 6.75 | 4.25 – 12.50 | Continued innovation and consumer willingness to pay for faster results sustain upward trend. |
Pricing Factors
Price variations depend on formulation complexity, brand positioning, distribution channel, and regional economic factors. Proprietary formulations with patented delivery systems tend to command higher prices. Premium natural or organic products increase average retail prices by about 20-25% over conventional options.
Implications for Market Entry
New entrants should expect to price products within the USD 3-10 range, with premium offerings surpassing USD 8. Competitive pricing combined with efficacy claims influences consumer choice.
Regulatory and Intellectual Property Considerations
Patent protection offers market exclusivity; patent expiry can lead to generic or private label competition, typically causing price erosion. Innovations that improve tolerability or efficacy may warrant patent filings, supporting higher pricing strategies.
Key Takeaways
- The global market for corn removers is approximately USD 1.2 billion, with steady growth projected.
- Price points are expected to climb from USD 5.50 in 2023 to about USD 6.75 in 2028, with regional and product-driven variability.
- Patent exclusivities and formulation innovations influence pricing and market share dynamics.
- Self-care trends, natural formulations, and e-commerce expansion contribute to ongoing market evolution.
FAQs
-
What are the leading active ingredients in OTC corn removers?
- Salicylic acid is the most common, often combined with urea or lactic acid.
-
How does patent protection influence market prices?
- Patents protect proprietary formulas, enabling higher pricing and exclusivity for several years; patent expirations generally lead to price reduction and increased competition.
-
What regional factors impact pricing?
- Variations in healthcare regulation, purchasing power, and distribution channels cause regional price differences.
-
Are natural or organic corn removers more expensive?
- Yes, formulations with natural ingredients tend to command higher retail prices, often 20-25% above conventional products.
-
What is the typical product lifetime before market saturation or decline?
- Patent protections last around 20 years from filing; after expiration, generic competition accelerates price erosion, typically within 2-3 years.
Sources: [1] MarketsandMarkets. Foot Care Market, 2022. [2] U.S. Food and Drug Administration. OTC skin protectants regulation. [3] IBISWorld. Foot Care Products Industry Report, 2023. [4] Statista. Consumer health market trends, 2022. [5] Company filings and patent databases.
More… ↓
