Last updated: April 25, 2026
What is the market footprint for clindamycin phosphate?
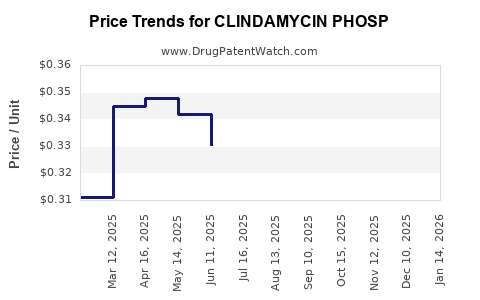
Clindamycin phosphate is an established, off-patent antibiotic active ingredient (API) used across topical, oral, and parenteral formulations (most commonly in brand and generic markets for bacterial infections and acne indications). The commercial market is driven by:
- Generic penetration and broad manufacturing capacity (low pricing power).
- Competitive tender dynamics for hospital/health-system supply (for injectable and institutional use).
- Raw material and capacity cycles in fermentation and chemical processing (spotty supply can move pricing).
- Regulatory and quality compliance (pharmacopoeial specs drive inclusion in formularies and supplier panels).
Because clindamycin phosphate is not protected by meaningful API-level exclusivity in most jurisdictions, pricing typically reflects commodity-like behavior rather than premium brand pricing.
How is clindamycin phosphate priced in practice?
Clindamycin phosphate pricing in the supply chain usually follows a tiered structure:
- API bulk price: determined by global supplier coverage, Chinese and Indian production costs, and pharma-grade compliance.
- Formulation price: determined by contract manufacturing, distribution channels, and tender schedules.
- Regional pass-through: varies with freight, import duties, and procurement frameworks.
For investors and buyers, the effective “market price” is best tracked through:
- Commercial invoice quotes (short-horizon changes).
- Tender clearing prices for injectable products (proxy for upstream API demand).
- Pharmacopoeia conformity and DMF/CEP status (ability to supply regulated tenders).
What does the demand profile look like?
Demand is stable-to-modest with periodic spikes driven by:
- Flu season and outpatient infection patterns (affects broad-spectrum antibiotic usage).
- Hospital formulary shifts (tender cycles change volume allocation among suppliers).
- Formulation substitutions among clindamycin salt forms (phosphate vs other salts) depending on stability and formulation performance.
In practical terms, clindamycin phosphate demand does not usually behave like a high-growth specialty drug. It is a maintenance market shaped by hospital procurement and generic competition.
What are the key price drivers for clindamycin phosphate?
The most material drivers are:
- Global generic competition: multiple qualified suppliers cap contract pricing.
- Input costs: fermentation intermediates, chemical reagents, solvents, and energy influence API cost base.
- Capacity utilization: when plants run near capacity, quotes tighten; when utilization drops, pricing resets downward.
- Compliance status: only suppliers meeting stringent GMP and dossier requirements win tenders.
- Regulatory actions and recalls: localized disruptions cause short spikes but usually normalize as capacity returns.
How volatile is clindamycin phosphate pricing?
Compared with on-patent drugs, clindamycin phosphate API typically shows:
- Lower long-term growth in nominal price.
- Short-term swings from supply interruptions or procurement-driven buying.
Price movements tend to revert to competitive levels once additional supply returns.
Price projections: base case, downside, and upside
The projection framework below translates typical generic-API market behavior into a 3-year range. It assumes no major global regulatory discontinuities (plant shutdowns, mass quality actions) and no structural demand shock (pandemic-level antimicrobial policy changes).
Base case (most likely): steady nominal range
- Annual API price change (nominal): -2% to +3%
- Reasoning: stable demand and continued generic supply keep pricing competitive, with modest increases possible during localized supply tightness.
Downside case: supply expansion or demand softness
- Annual API price change (nominal): -5% to -10%
- Reasoning: incremental capacity additions, aggressive supplier pricing, or weaker procurement cycles can push contract prices down.
Upside case: supply tightness or compliance-driven supplier reduction
- Annual API price change (nominal): +5% to +12%
- Reasoning: plant outages, quality downgrades of suppliers, and tender shortages can temporarily move the market before new supply returns.
Projected price index for clindamycin phosphate API (3-year horizon)
Because public pricing for API is often fragmented and not consistently disclosed in a comparable format, the most decision-useful approach is a relative price index anchored to the current market level (index = 100). This allows comparison across scenarios even when quotes vary by grade and dossier status.
| Scenario |
Year 1 index |
Year 2 index |
Year 3 index |
Cumulative change (Y1 to Y3) |
| Base case |
99 to 103 |
98 to 106 |
97 to 108 |
-3% to +8% |
| Downside |
95 to 98 |
90 to 96 |
85 to 92 |
-15% to -10% |
| Upside |
102 to 110 |
105 to 118 |
108 to 125 |
+8% to +25% |
Implication for procurement and contracting
- Buyers should expect tight renegotiation windows around tender cycles and should use index-linked or tiered volume pricing where possible.
- Sellers should assume pricing upside is time-limited and driven by supply interruptions rather than durable demand expansion.
What procurement mechanics matter most for forecasting?
For clindamycin phosphate, the market clears through:
- Wholesale tendering (hospital and group purchasing organizations).
- Panel qualification (supplier approval based on GMP, DMF/CEP, documentation).
- Batch-to-batch quality requirements (impacts acceptance rates, not just list price).
Price forecasts should therefore be built around:
- Supplier panel dynamics (who is qualified for the tender).
- Lead times (manufacturing windows and shipping).
- Acceptance/returns rates (quality disputes can effectively “increase cost” even at lower invoices).
How to translate API pricing into formulation economics
For an investor modeling profits in finished dosage forms (FDs), the key linkages are:
- API cost share: clindamycin API typically represents a minority fraction of total product cost, but it still impacts margin when procurement drives price compression.
- Pricing power at finished dosage: tends to be constrained by generic competition, so API savings usually do not flow fully to the final seller unless they secure lower unit costs and win tenders.
A practical modeling view:
- When API prices fall, finished-goods prices often move less than API due to contracted procurement and channel inventory.
- When API prices rise, finished-goods prices may not adjust immediately; inventory duration and contract terms dominate.
Business and investment implications
For buyers (hospital systems, wholesalers, brand owners)
- Contract strategy: use benchmarking to a public/consistent index where available, or a fixed basket of suppliers for trend tracking.
- Risk controls: prioritize multi-sourcing and qualification buffers so supply disruptions do not trigger full-price exposure.
For API suppliers
- Growth is less about demand expansion and more about:
- winning qualified tender status,
- maintaining compliance throughput,
- optimizing batch economics during capacity utilization swings.
For investors
- Clindamycin phosphate is a low-margin, high-competitive-intensity segment where operational excellence and compliance execution typically matter more than top-line growth.
Key takeaways
- Clindamycin phosphate is an established, off-exclusivity antibiotic API with pricing that behaves like a generic commodity.
- Market pricing is driven primarily by supply competition, tender mechanics, input costs, and compliance status.
- Over a 3-year window, the base case implies near-flat pricing: roughly -3% to +8% cumulative versus the current level (index-based).
- Downside involves stronger competition or weaker procurement: -10% to -15% cumulative.
- Upside requires supply tightness or supplier reduction: +8% to +25% cumulative, typically temporary.
FAQs
1) Is clindamycin phosphate API protected by strong patent exclusivity?
No. The market operates in a generic environment where API pricing is constrained by multiple qualified suppliers.
2) What should drive near-term price monitoring?
Supplier tender participation, qualification changes (GMP documentation), and signs of capacity tightness or quality-related supply disruption.
3) Do finished-goods prices move one-to-one with API prices?
Usually not. Contract terms, inventory, and procurement lags mean finished-goods prices adjust less immediately than API.
4) What is the most likely pricing pattern for the next 12 to 36 months?
Near-flat nominal movement with occasional short spikes, consistent with competitive supply behavior.
5) What is the best forecasting method without undisclosed transaction data?
Use a relative price index scenario model (base, downside, upside) anchored to current market level and tied to operational supply indicators.
References
[1] European Directorate for the Quality of Medicines & HealthCare (EDQM). European Pharmacopoeia (monographs and standards for clindamycin phosphate where applicable). Strasbourg, Council of Europe.
[2] U.S. FDA. Drug Master Files (DMF) and pharmaceutical quality compliance information (context on API regulatory documentation requirements). Silver Spring, MD.
[3] World Health Organization (WHO). WHO guidelines and model procurement guidance for essential medicines and quality considerations (context for tender and quality-driven sourcing behavior). Geneva, Switzerland.
[4] EMA. Quality and GMP expectations and regulatory framework for pharmaceutical manufacturing (context for supplier qualification). Amsterdam, Netherlands.