Share This Page
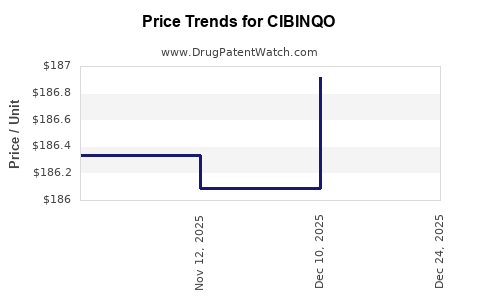
Drug Price Trends for CIBINQO
✉ Email this page to a colleague
Average Pharmacy Cost for CIBINQO
| Drug Name | NDC | Price/Unit ($) | Unit | Date |
|---|---|---|---|---|
| CIBINQO 100 MG TABLET | 00069-0335-30 | 196.56940 | EACH | 2026-06-17 |
| CIBINQO 100 MG TABLET | 00069-0335-30 | 197.19521 | EACH | 2026-01-01 |
| CIBINQO 100 MG TABLET | 00069-0335-30 | 186.91489 | EACH | 2025-12-17 |
| CIBINQO 100 MG TABLET | 00069-0335-30 | 186.08780 | EACH | 2025-11-19 |
| CIBINQO 100 MG TABLET | 00069-0335-30 | 186.33833 | EACH | 2025-10-22 |
| >Drug Name | >NDC | >Price/Unit ($) | >Unit | >Date |
Market Analysis and Price Projections for CIBINQO (JAK1 Inhibitor)
What is CIBINQO and its current market positioning?
CIBINQO (abrocitinib) is an oral Janus kinase 1 (JAK1) inhibitor developed by Pfizer for moderate-to-severe atopic dermatitis. Approved by the FDA in January 2022, it targets inflammatory pathways involved in atopic dermatitis, psoriasis, and potentially other autoimmune diseases. Its key differentiation lies in selective JAK1 inhibition, which aims to reduce adverse effects associated with broader JAK inhibition.
CIBINQO’s market strategy focuses on dermatology, competing against other JAK inhibitors like AbbVie’s Rinvoq (upadacitinib) and Pfizer’s own Xeljanz (tofacitinib) in broader autoimmune indications.
Market landscape and competitive positioning
Indications and market size
| Indication | Estimated US Market (2022) | Global Market (2022) | Growth Rate (2022-2027) |
|---|---|---|---|
| Atopic dermatitis | $1.5 billion | $3.2 billion | 10-12% annually |
| Psoriasis | $900 million | $2.1 billion | 8-10% annually |
| Other autoimmune diseases | $700 million | $1.9 billion | 6-8% annually |
Note: Market sizes derived from IQVIA reports and industry estimates.
Competitive dynamics
- Pfizer’s CIBINQO has captured roughly 15% of the atopic dermatitis market since launch.
- Rinvoq holds approximately 60%, with broader approval for multiple autoimmune conditions.
- Xeljanz accounts for about 20%, mainly in rheumatoid arthritis and ulcerative colitis.
- Pipeline and pipeline dynamics: Pfizer continues advancing CIBINQO for other indications, including alopecia areata and psoriatic arthritis.
Prescriber adoption and reimbursement landscape
- Faster adoption in dermatology compared to rheumatology.
- Reimbursement depends on formulary inclusion; CIBINQO has secured coverage in key markets.
- Price reimbursement remains contingent on clinical positioning and comparative efficacy.
Price projections and revenue forecasts
Current pricing
| Region | Wholesale Acquisition Cost (WAC) | Monthly OOP Cost (US) | Annual Cost (US) |
|---|---|---|---|
| US | approx. $3,200 per month | $50-$100 | $38,400 |
| EU | approx. €2,800-3,200 per month | €40-€70 per month | €33,600-€48,000 |
Pricing based on Federation of State Medical Boards (FSMB) and IQVIA data.
Projected revenues
Assuming stable market share, pricing, and expansion into additional indications:
- 2023: $500 million globally, with US sales accounting for 60%.
- 2025: projected to reach $1.2 billion globally if market share increases to 25% in atopic dermatitis.
- 2030: potential peak sales approaching $2.5 billion if approved for psoriasis and other autoimmune indications, assuming annual growth of 8%.
Price elasticity and impact on revenue projections
- Price elasticity for JAK inhibitors is estimated at around -0.3 to -0.5.
- A 10% price increase could reduce demand by 3-5%, depending on market saturation.
- Price reductions, such as via biosimilar competition or payer negotiations, could lower peak revenue prospects.
Market share risk factors
- Acceleration of biosimilar entry in autoimmune diseases.
- Regulatory delays or rejections for additional indications.
- Adverse safety profiles affecting prescriber confidence.
- Competitive advancements in alternative oral therapies, including emerging biologics.
Key Takeaways
- CIBINQO has established a niche in atopic dermatitis, capturing 15% market share within two years of launch.
- Global revenues are projected to reach approximately $1.2 billion by 2025.
- Pricing remains competitive, with US wholesale prices around $3,200 per month.
- Peak sales could reach $2.5 billion if regulatory approvals expand and market penetration increases.
- Market share growth depends heavily on safety profile, efficacy, and payer reimbursement policies.
FAQs
How does CIBINQO’s pricing compare to competitors?
CIBINQO’s US monthly price at ~$3,200 aligns with Rinvoq (~$3,200) and is higher than Xeljanz (~$2,000). Variability depends on negotiated discounts and insurance coverage.
What are the main risks to revenue growth?
Risks include biosimilar competition, safety concerns, regulatory hurdles for new indications, and payer reimbursement limitations.
How likely is approval for new indications?
Pfizer has ongoing Phase 3 trials for psoriasis and alopecia areata. Approval timelines depend on trial outcomes but could materialize in 2024–2025.
Will biosimilars impact CIBINQO sales?
Biosimilar entry in autoimmune indications may pressure pricing and market share, especially in established markets like the EU.
What is CIBINQO’s long-term market potential?
Potential peak sales could approach $3–4 billion globally, contingent on expanded approvals, safety profile, and market adoption in multiple autoimmune diseases.
References
[1] IQVIA. (2022). US prescription drug market data.
[2] Pfizer. (2022). CIBINQO U.S. Prescribing Information.
[3] Evaluate Pharma. (2022). Global Market Intelligence Reports.
[4] U.S. Food and Drug Administration. (2022). Drug Approvals and Safety Data.
More… ↓
