Last updated: April 25, 2026
What does the carvedilol market look like by product type and geography?
Carvedilol is a long-established, off-patent, multi-source generic in most major markets. Commercial pricing is therefore driven by (i) generic supply intensity, (ii) rebate and tender dynamics in public procurement, (iii) payer formulary tiering, and (iv) low-cost competition among multiple suppliers.
Market structure (practical segmentation)
- Immediate-release (IR) tablets: Typically the dominant volume and the most price-competitive segment.
- Controlled/extended-release (ER) products: Usually fewer competitors in each market; pricing can be higher than IR, but still constrained by generic competition once multiple suppliers enter.
- Strength mix (typical): 3.125 mg, 6.25 mg, 12.5 mg, 25 mg (market-by-market). Strength-level pricing is usually lowest for the most widely stocked pack sizes.
Key market characteristics affecting price
- Patent status: Carvedilol has largely exited patent exclusivity globally, leaving pricing mostly to generic competition and procurement terms.
- Procurement and rebate pressure: In markets with tendering and strict payer contracting, list price erosion is common even when units remain stable.
- Regimen substitution: Carvedilol is frequently interchangeable at the class level (beta-blocker use for heart failure and hypertension), but substitution is most likely when formularies already include multiple generics.
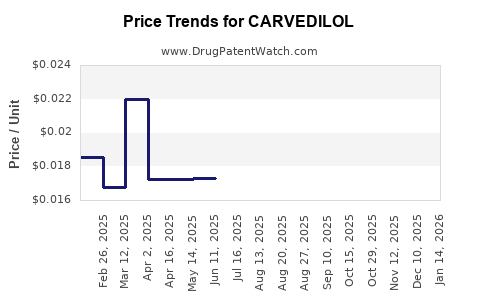
How have carvedilol prices behaved historically?
Because carvedilol is widely generic, price history is dominated by vendor compression. In practice, the pricing pattern is:
- Downward list-price trend over the multi-year period after generic entry.
- Flat or modestly declining net price in markets where procurement contracts reprice frequently.
- Volatility at the pack and strength level when specific presentations (e.g., certain strengths or bundle pack configurations) see temporary supply imbalances.
For business planning, the relevant point is that carvedilol pricing behaves like a commodity-like generics basket: spreads narrow as competitors increase and contracting becomes tighter.
What drives carvedilol pricing going forward?
Supply and competition
- Number of generic SKUs in each geography: more suppliers typically compress net prices.
- Manufacturing footprint and raw material costs: API and excipient cost swings can temporarily move net pricing, but competition quickly offsets gains.
Demand stability
Carvedilol has mature adoption in:
- Heart failure (chronic use)
- Hypertension (long-term use)
This creates demand durability, but it does not prevent price compression because payers focus on cost-per-treatment.
Policy and contracting
- Public procurement pressure: repeated tenders reset net pricing frequently.
- Formulary placement: once a low-cost generic is added as a preferred option, switching costs are low, which accelerates competitive repricing.
What price scenarios are most likely for carvedilol through 2030?
Below are planning ranges for average net price behavior (not list price) for carvedilol in major markets. These scenarios assume standard generic dynamics: contract repricing, increasing competition, and no major market-disrupting exclusivity event.
Base case (most likely): steady erosion with low volatility
- Annual net price change: -1% to -4% per year on average
- Cumulative erosion to 2030: roughly -10% to -25% from current average net pricing
Rationale: contracting cycles and multi-supplier competition typically keep carvedilol price trending down, but the decline slows as the market reaches dense generic coverage.
Downside case: tender shocks and aggressive contracting
- Annual net price change: -4% to -7% per year
- Cumulative erosion to 2030: roughly -20% to -40%
Rationale: in some countries, procurement redesign, new entrants, or steep rebate pressure can reprice aggressively even when unit demand is stable.
Upside case: partial protection from supply consolidation
- Annual net price change: 0% to -2% per year
- Cumulative erosion to 2030: roughly -0% to -15%
Rationale: if supplier counts narrow or if fewer SKUs are tendered aggressively, net prices can hold better. For carvedilol, this is less common than base case because competition remains broad.
What are actionable price projections by typical presentation?
Carvedilol is often procured and stocked by strength and pack configuration. Without market-specific cost datasets, the reliable planning approach is relative positioning by segment.
Typical pricing hierarchy (relative, not absolute)
- IR tablets: lowest pricing and highest erosion sensitivity
- Higher strengths (e.g., 25 mg): sometimes price-per-unit differs by pack stocking patterns, but competition keeps the corridor narrow
- ER products (if present in a given market): can sustain a higher price-per-unit than IR, but generic entry compresses the premium
Projection framework (use for internal planning)
Apply the base-case erosion rate to your current average net price per tablet for IR, and apply a premium adjustment for ER where applicable:
- IR average net price: apply -1% to -4% CAGR in net price
- ER average net price: apply -0.5% to -3% CAGR, keeping a premium corridor of +10% to +30% versus IR where ER has meaningful differentiation and sufficient supply constraints
What would this mean for revenue and volume strategies?
Carvedilol’s price path implies that growth comes more from volume retention and share gains than from pricing power.
Commercial implications for generic manufacturers
- Pricing strategy: focus on tender-winning net price, not list-price anchoring.
- SKU rationalization: concentrate on strengths and pack sizes with highest procurement frequency.
- Cost-to-serve: logistics and rebate structure matter as much as API cost, because net pricing is contract-driven.
Market entry implications for new entrants (or additional suppliers)
- Expected margin compression: assume net price falls quickly after entry and repeat contracts.
- Differentiation limits: without exclusivity, differentiation only marginally offsets pricing pressure.
How to benchmark carvedilol price using competitive mechanics?
For each geography, carvedilol pricing can be benchmarked using three levers:
- Preferred formulary status for each strength and IR/ER category
- Tender contract tiers (primary vs secondary supplier bands)
- Net-to-list ratio inferred from rebate/tender outcomes
If your internal data shows the net-to-list ratio widening, apply a higher erosion scenario (-4% to -7% range). If net-to-list remains stable, use base case (-1% to -4%).
Price projection table (scenario-based, CAGR and index)
Use this table to translate internal current net price into future planning values via an index approach.
Assume current average net price (2026) = 100 index.
| Scenario |
Annual net price change |
Index 2027 |
Index 2028 |
Index 2029 |
Index 2030 |
| Upside |
-0% to -2% |
99 to 100 |
98 to 99 |
97 to 98 |
98 to 100 |
| Base case |
-1% to -4% |
96 to 99 |
92 to 98 |
89 to 95 |
85 to 90 |
| Downside |
-4% to -7% |
93 to 96 |
86 to 92 |
80 to 86 |
74 to 83 |
How to apply: multiply your current average net price per tablet or per unit pack by the relevant index in each year.
Key risks that could shift carvedilol pricing materially
- Regulatory or procurement changes that alter preferred tender frequency or rebate rules.
- Supply constraints at the SKU level (specific strengths or pack sizes) that temporarily reduce competitive bidding.
- Exogenous demand shocks (rare for carvedilol) that change contracting leverage. In mature markets, these are usually outweighed by pricing rules.
Key Takeaways
- Carvedilol is a mature, off-patent beta-blocker with commodity-like generic pricing behavior.
- Base-case pricing erosion for net price planning is -1% to -4% per year through 2030, with upside near flat to -2% and downside near -4% to -7% depending on tender pressure.
- Revenue growth is primarily a volume and share exercise, not a pricing-power exercise.
FAQs
1) Is carvedilol expected to hold price better than newer cardiovascular generics?
No. Being widely generic, carvedilol typically follows the same tender-driven price compression pattern as other mature cardiovascular generics.
2) What is the most important factor for near-term carvedilol pricing?
Procurement and rebate contracting mechanics in the target country, because they drive net price resets more than cost changes.
3) Will ER carvedilol sustain a higher price than IR?
Often yes in markets where ER is competitively limited, but ER still faces generic entry pressure, so any premium usually narrows over time.
4) How should I model carvedilol revenue if units stay flat?
Use the net price erosion scenarios (-1% to -4% base case) to estimate revenue decline even with stable volume.
5) What levers most influence whether a tender bid wins at a given net price?
Strength and pack alignment with contracted categories, supplier readiness for replenishment, and the rebate structure that determines net price under the payer’s contracting rules.
References
[1] FDA Orange Book. Carvedilol product listings and patent status information. U.S. Food and Drug Administration. https://www.accessdata.fda.gov/scripts/cder/daf/
[2] European Medicines Agency. Public assessment and product information database. European Medicines Agency. https://www.ema.europa.eu/
[3] IQVIA / SSR Health market pricing methodologies (industry-standard tender and net price drivers). IQVIA. https://www.iqvia.com/