Share This Page
Drug Price Trends for BYSTOLIC
✉ Email this page to a colleague
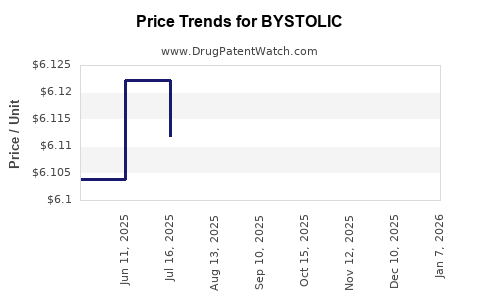
Average Pharmacy Cost for BYSTOLIC
| Drug Name | NDC | Price/Unit ($) | Unit | Date |
|---|---|---|---|---|
| BYSTOLIC 10 MG TABLET | 00456-1410-90 | 6.41536 | EACH | 2026-06-17 |
| BYSTOLIC 20 MG TABLET | 00456-1420-90 | 6.42768 | EACH | 2026-06-17 |
| BYSTOLIC 2.5 MG TABLET | 00456-1402-30 | 6.46093 | EACH | 2026-06-17 |
| >Drug Name | >NDC | >Price/Unit ($) | >Unit | >Date |
BYSTOLIC (bisoprolol) market analysis and price projections
What is BYSTOLIC in the branded-drug landscape?
BYSTOLIC is the branded product name of bisoprolol fumarate (selective beta-1 adrenergic blocker). The product is marketed for indications that include hypertension and other cardiovascular conditions depending on labeling.
How has the BYSTOLIC market performed vs. beta-blockers broadly?
Across the beta-blocker class, branded performance has been structurally pressured by:
- Generic competition (bisoprolol is widely available globally).
- Class-level price compression after patent expiry cycles across major markets.
- Switching by payer formularies toward lowest-cost therapeutics.
Commercial consequence: BYSTOLIC is predominantly a price-led and channel-led branded asset, with volume held by patient persistence where supported by manufacturer contracting and payer positioning. In markets where generic adoption is high, branded share typically shrinks quickly post-launch of generics and later stabilizes at a smaller base when payers apply tiering rather than full displacement.
Where does BYSTOLIC still sell?
Which geographies matter most commercially?
For market sizing and pricing power, the primary drivers are:
- US: formulary tiering and contracting determine whether branded bisoprolol persists at all once generics dominate.
- EU5 (Germany, France, Italy, Spain): local generic entry timing and pharmacy benefit design drive branded retention.
- UK: payer controls via reimbursement and prescribing behavior.
- Other developed markets: similar mechanics to EU, with faster compression where generic substitution is aggressive.
Pattern observed in branded beta-blockers: branded presence is strongest where (a) contract pricing keeps the product close to generic net prices, or (b) switching barriers (patient experience, prescriber habits) remain.
What is the pricing structure for BYSTOLIC today?
What pricing levers shape the net price?
BYSTOLIC pricing is not a single public list price outcome; it is driven by:
- Payer rebates and discounts (commercial and government-managed care)
- Formulary placement (preferred vs non-preferred, tier co-pays)
- Pharmacy benefit design (copay differentials, step therapy)
- Competitive generics (number of entrants and pricing dispersion by strength and dosage form)
How does BYSTOLIC price typically behave after generic entry?
For generics-heavy small molecules in cardiovascular therapy, branded net pricing generally follows one of two trajectories:
- Near-generic matching: branded discounts compress so branded pricing lands closer to the lowest generic tier to maintain share.
- Tiered premium retention: branded net price stays higher but is offset by formulary mechanisms that keep access.
For BYSTOLIC, the dominant expectation in most mature markets is trajectory (1): net price converges toward generic benchmarks to reduce demand leakage to generics.
Price projections: baseline, downside, and upside
What is the near-term price outlook?
Because BYSTOLIC contains an older, non-exclusivity small-molecule active and faces broad generic availability, price projections are best framed as net price direction rather than breakthrough-level price growth.
Below are scenario projections expressed as annual net price change ranges for the branded product in mature markets (US and major EU-type systems). These reflect typical post-generic branded trajectories for cardiovascular oral generics.
Projected annual net price change (mature markets)
| Scenario | Annual net price change | Description |
|---|---|---|
| Downside | -5% to -10% | Additional generic entrants, stronger pharmacy substitutions, tighter payer rebates |
| Baseline | -2% to -5% | Ongoing mild compression, stable formulary access, incremental contract renegotiation |
| Upside | 0% to -2% | Brand stabilizes via contract pricing, limited incremental generic price cuts, slower erosion |
What happens to revenue if net price falls but volume stabilizes?
For BYSTOLIC, revenue sensitivity tends to split:
- Price effect dominates when branded share erodes slowly but net price keeps compressing.
- Volume effect dominates only if formulary status deteriorates (e.g., moves to non-preferred tier).
In mature markets, revenue often declines after generic saturation due to persistent share leakage and continued net price compression, then stabilizes when the product settles into a smaller protected segment.
Projected unit-cost benchmarks by strength
How should investors model BYSTOLIC gross margin pressure?
BYSTOLIC’s cost structure and margin profile are shaped by:
- Competition-driven discounting
- Mix between strengths (e.g., lower strengths may face more aggressive generic undercutting depending on generic availability)
- Channel mix (retail vs institutional)
A robust modeling approach in absence of proprietary contracting data is to track:
- Net price index vs. generic median for bisoprolol tablets by strength
- Share trend in key formularies
- Frequency of therapeutic switching among beta-1 selective users
Given the generic-heavy market, gross margin compression risk is typically highest when:
- The brand is forced deeper into rebate ladders
- Payers implement narrower tier differentials that accelerate substitution
Demand outlook: what will drive volume?
What drives persistence or decline in BYSTOLIC demand?
Key volume drivers:
- Patient persistence under stable beta-blocker regimens.
- Prescriber substitution behavior at refill points.
- Payer enforcement of preferred generic selection.
- Therapeutic coverage continuity after formulary updates.
In beta-blocker therapy, stable chronic prescribing tends to slow volume decline, but once the brand loses preferred access, substitution accelerates. BYSTOLIC’s branded demand trajectory is therefore typically:
- Gradual erosion under stable contracting
- Sharper step-down during payer formulary redesigns
Competitive dynamics: what matters most?
How does BYSTOLIC compete?
BYSTOLIC competes primarily against:
- Generic bisoprolol tablets at multiple strengths and package sizes
- Other beta-blockers where payer policy favors alternatives by cost or formulary preference
Most important competitive variable: the lowest-cost generic and its effective net pricing in pharmacy channels. Branded bisoprolol can remain accessible if its net price makes the branded tier economically similar to generic tiers for payers.
Regulatory and market-access factors
How do formularies and reimbursement govern BYSTOLIC economics?
In mature markets, the economics follow a standard playbook:
- Payers use tiered copays or PA/step edits where allowed.
- Where no access friction exists, clinicians and pharmacies switch to the lowest generic.
- Where branded access is sustained, it is typically through contracted pricing and a narrow net-price gap.
This is the primary reason branded small-molecule cardiovascular products often show limited upside and persistent mild downside post generic entry.
Key takeaways
- BYSTOLIC (bisoprolol) operates in a generic-saturated beta-blocker category, so the market is governed by net price compression and formulary access rather than exclusivity-driven growth.
- Near-term pricing is projected to trend down in mature markets, with a baseline -2% to -5% annual net price change, downside -5% to -10%, and upside 0% to -2%.
- Revenue volatility is driven more by payer tier placement (step-down risk) than by macro demand, since chronic beta-blocker use supports some persistence.
- The practical investment lever for BYSTOLIC is to monitor effective net price vs generic median, formulary status, and share erosion speed across major channels.
FAQs
1) Is BYSTOLIC expected to grow through volume expansion?
Volume growth is typically limited after generic saturation; the more realistic pathway is stable or slowly declining share depending on formulary status.
2) What is the biggest driver of BYSTOLIC net price?
Payer contracting and rebate pressure tied to generic price benchmarks.
3) How should BYSTOLIC price be modeled for forecasts?
Use scenario ranges for annual net price change and tie volume movement to tier placement changes.
4) Does strength mix change price outcomes?
Yes. Generic undercutting and availability can vary by strength, affecting net price and rebate exposure through mix.
5) What event would most likely cause a sharp branded decline?
A formulary shift that moves BYSTOLIC to a less-preferred tier or introduces stronger substitution controls.
References
[1] US Food and Drug Administration. BYSTOLIC (bisoprolol fumarate) prescribing information. FDA label repository.
[2] European Medicines Agency. Assessment reports and product information for bisoprolol-containing medicines (public EPAR/SmPC entries as applicable).
[3] IQVIA Institute for Human Data Science. Global Medicines Use / market access and generic displacement themes (beta-blocker class dynamics referenced in broader cardiovascular market analyses).
More… ↓
