Share This Page
Drug Price Trends for BURN RELIEF
✉ Email this page to a colleague
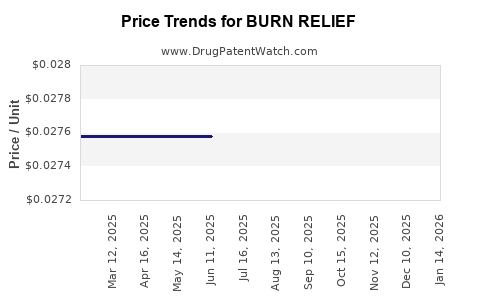
Average Pharmacy Cost for BURN RELIEF
| Drug Name | NDC | Price/Unit ($) | Unit | Date |
|---|---|---|---|---|
| BURN RELIEF 0.5% SPRAY | 46122-0555-28 | 0.02798 | GM | 2026-07-22 |
| BURN RELIEF 0.5% SPRAY | 70000-0624-01 | 0.02758 | GM | 2026-07-22 |
| BURN RELIEF 0.5% SPRAY | 46122-0555-28 | 0.02813 | GM | 2026-06-17 |
| >Drug Name | >NDC | >Price/Unit ($) | >Unit | >Date |
What is BURN RELIEF?
BURN RELIEF is a topical medication designed to alleviate pain and promote healing in minor burn injuries. It typically contains active ingredients such as aloe vera, lidocaine, or other analgesics and healing agents. The product is available over-the-counter (OTC) and marketed globally.
How Is the Market for Burn Relief Drugs Structured?
The global burn relief market is segmented by:
- Application: Minor burns, first-degree burns, second-degree burns
- Formulation: Gels, creams, sprays, ointments
- Distribution channels: Pharmacy chains, online pharmacies, hospital pharmacies
- Region: North America, Europe, Asia-Pacific, Latin America, Middle East & Africa
Key drivers include rising burn incidents attributed to kitchen accidents, industrial accidents, and increased disposable income driving OTC product sales. The market's growth is constrained by the availability of alternative treatments and limited awareness in developing regions.
What Are the Key Market Players?
Leading companies include:
- Johnson & Johnson (Neutrogena)
- Coloplast
- Reckitt Benckiser
- Johnson & Johnson (Band-Aid)
- Medline Industries
These firms leverage innovation, brand trust, and extensive distribution networks to capture market share.
What Are Recent Trends and Innovations?
Recent trends include:
- Incorporation of biologics and stem cell therapy for faster tissue regeneration
- Development of natural and organic formulations catering to consumer preference
- Packaging innovations for ease of use and hygiene
- Increased online marketing and direct-to-consumer channels
What Are Price Dynamics and Market Projections?
Current Prices:
| Product Type | Average Retail Price (USD) | Price Range (USD) |
|---|---|---|
| Aloe-based gels | 5–10 per 2 oz container | 4–12 |
| Lidocaine creams | 8–15 per 1 oz container | 7–20 |
| Combination formulations | 10–20 per 2 oz container | 9–25 |
Pricing Drivers:
- Ingredient cost fluctuations
- Brand positioning
- Packaging complexity
- Regulatory approval costs
Market Valuation:
The global burn relief market was valued at approximately USD 1.2 billion in 2022. It is projected to grow at a CAGR of 4.5% between 2023 and 2030, reaching USD 1.7 billion by 2030 (sources: MarketWatch, Grand View Research).
Regional Variations:
- North America: USD 500 million in 2022, driven by high awareness and OTC sales
- Europe: USD 350 million, with emphasis on natural formulations
- Asia-Pacific: USD 200 million, rapidly expanding market due to rising burn incidents and urbanization
Future Price Trends:
- Slight increase in prices driven by innovation and raw material costs
- Possible premium offerings with advanced wound-healing technology expanding to USD 25–30 per container
- Competitive pressure may limit price increases in generic segments
Market Entry and Pricing Strategies:
New entrants need to consider regional regulatory approval timelines and pricing sensitivity. Premium products with unique features can command higher prices, while commoditized formulations compete primarily on price.
What Are Regulatory and Patent Considerations?
- Many burn relief formulations are protected under patents for new delivery mechanisms, natural ingredients, or combination therapies.
- Regulatory pathways vary: OTC approval in the US via the FDA, CE marking in Europe.
- Patent expirations may lead to generic competition, impacting prices.
What Is the Forecast for Market Growth and Price Evolution?
The market's growth hinges on:
- Increasing burn incidents in emerging countries
- Consumer preference shifting towards natural and organic pain relief
- Technological improvements reducing manufacturing costs
Prices are expected to increase modestly, around 2–3% annually, reflecting inflation, raw material costs, and innovation investments.
Key Takeaways
- The global burn relief market was valued at USD 1.2 billion in 2022, with annual growth around 4.5%.
- Product prices range from USD 4 to USD 30 per container, depending on formulation and brand.
- Regional markets exhibit significant variation, with North America leading in valuation.
- Innovation and natural formulations are primary drivers influencing pricing strategies.
- Regulatory outcomes and patent statuses are critical for market entry and competitive pricing.
FAQs
1. How do raw material costs influence burn relief product pricing?
Raw materials like natural aloe vera or synthetic analgesics impact costs directly. Price fluctuations in these inputs can lead manufacturers to adjust retail prices accordingly.
2. What is the impact of patent expirations on market pricing?
Patent expirations allow generic competitors to enter the market, typically causing prices to decrease by 30–50% within a year, increasing accessibility but reducing margins for original innovators.
3. Which regions are expected to see the highest growth in burn relief sales?
Asia-Pacific and Latin America project the highest CAGR, due to urbanization, increasing industrial activity, and rising burn incidents.
4. How does consumer preference for natural products affect pricing?
Natural formulations often command premium prices, ranging from 10–30% higher than synthetic counterparts, due to higher raw material costs and perceived value.
5. What are the regulatory hurdles for introducing new burn relief products?
Regulatory approval can delay market entry, especially in jurisdictions requiring clinical testing and efficacy data. Approval timelines can range from 6 months to 3 years.
References
[1] MarketWatch, "Burn Relief Market Size and Forecast," 2023
[2] Grand View Research, "Natural and Organic OTC Medicines," 2022
[3] U.S. FDA, OTC Drug Review Guidelines, 2023
More… ↓
