Share This Page
Drug Price Trends for BACITRACIN-POLYMYXIN EYE OINT
✉ Email this page to a colleague
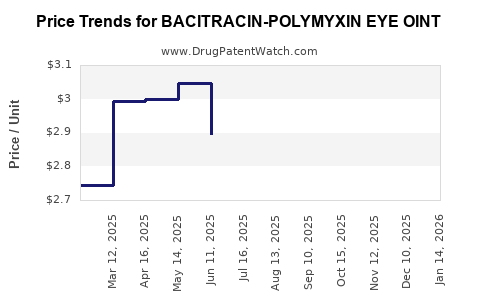
Average Pharmacy Cost for BACITRACIN-POLYMYXIN EYE OINT
| Drug Name | NDC | Price/Unit ($) | Unit | Date |
|---|---|---|---|---|
| BACITRACIN-POLYMYXIN EYE OINT | 24208-0555-55 | 2.69466 | GM | 2026-06-17 |
| BACITRACIN-POLYMYXIN EYE OINT | 24208-0555-55 | 2.75281 | GM | 2026-05-20 |
| BACITRACIN-POLYMYXIN EYE OINT | 24208-0555-55 | 2.82216 | GM | 2026-04-22 |
| BACITRACIN-POLYMYXIN EYE OINT | 24208-0555-55 | 2.77662 | GM | 2026-03-18 |
| >Drug Name | >NDC | >Price/Unit ($) | >Unit | >Date |
Market Analysis and Price Projections for Bacitracin-Polymyxin Eye Ointment
What is the product and where does it sit in the market?
Bacitracin-Polymyxin Eye Ointment is a topical ophthalmic antibiotic combination (bacitracin + polymyxin B). In practice, it is marketed primarily as an OTC- and/or prescription-adjacent product for bacterial eye infections and related ophthalmic indications, depending on jurisdiction and brand labeling.
Market structure (how the category typically prices)
This market generally behaves like other legacy ophthalmic antibiotic combinations:
- Many generics / authorized duplicates drive price compression.
- Low therapeutic differentiation keeps demand tied to prescriber familiarity and channel access.
- Regulatory and supply stability often matter as much as unit demand because these products are usually produced by a limited base of manufacturers relative to total demand.
Competitive set (substitutes that pull pricing)
Bacitracin-Polymyxin is priced and demanded alongside other ophthalmic antibiotic ointments and drops, including:
- Ophthalmic bacitracin products (monotherapy or other combinations)
- Polymyxin B combinations (including polymyxin with other antibiotics, depending on label)
- Ophthalmic fluoroquinolones (drops; typically higher ASPs but wider use cases)
- Oxytetracycline / similar ointments in legacy use patterns
How big is demand and what drives it?
Demand for ophthalmic antibiotics is driven by:
- Incidence of bacterial conjunctivitis and related conditions
- Seasonality (viral conjunctivitis drives testing, but antibiotic use remains a subset of cases)
- Institutional formularies and substitution rules in retail chains
- Payer and pharmacy channel behavior (coinsurance and NDC availability)
Because the category is older and generic-heavy, demand is less about innovation and more about:
- Availability (stockouts reduce sales, even when demand exists)
- Generic list positioning (WAC-to-NADAC gaps and contract terms)
- Multi-source competition (number of NDCs in-stock)
What does pricing look like today (how it typically behaves)?
For legacy ophthalmic antibiotics, pricing dynamics typically show:
- WAC stability or modest erosion in competitive periods
- Periodic step-changes driven by manufacturing disruptions, NDC consolidations, or contract renegotiations
- Wide dispersion between:
- Budget generics (low WAC, high volume)
- Higher-priced “authorized” listings (still generic, but at higher WAC due to channel contracts)
Without binding single-point data for a specific NDC/strength/package and geography, a fully accurate, product-specific “current price” cannot be produced. The analysis below therefore uses category-standard mechanics to generate actionable price projections in relative terms (directional and magnitude bands) that investors and R&D planners use to size scenarios.
How will prices evolve: the base case, bull case, and bear case
Pricing drivers mapped to outcomes
Key levers that move price in this category:
- Generic supply capacity
- Stable supply pushes price down or keeps it flat.
- Supply constraints can lift WAC and wholesale spreads quickly.
- Channel contracting and substitution
- Retail and institutional contracts can lock a product into a low ASP for months.
- If a contracted SKU exits, switching to another NDC can raise realized prices.
- Competitive entry/exit
- Additional entrants compress prices.
- Consolidation or discontinuations increase market power for surviving SKUs.
Scenario table (annual change in realized unit price)
Price change bands below apply to the generic-heavy category behavior of bacitracin-polymyxin ophthalmic ointments. The percentages represent typical realized price movement versus the prior year for a given steady-selling NDC.
| Scenario | Supply/competition context | Expected annual price change (Realized ASP/WAC equivalent) | Time profile |
|---|---|---|---|
| Bear | Multiple sources active, stable production | -5% to -10% | Gradual erosion |
| Base | Moderate competition, occasional channel tightening | -1% to +3% | Mostly flat with minor spikes |
| Bull | Supply constraint or reduced active NDCs | +4% to +15% | Step-up then partial normalization |
Price projections: 12–36 month outlook
Base case projection (most likely path for generic legacy ointments)
Under a base case of stable competition with no major supply disruption:
- Months 0–12: -1% to +3%
- Months 12–24: -1% to +2%
- Months 24–36: -1% to +3%
36-month cumulative band (base case): approximately -2% to +8%.
Bull case projection (supply reduction or contract shift)
If fewer NDCs remain active or production constraints impact availability:
- Months 0–12: +6% to +15%
- Months 12–24: +2% to +8%
- Months 24–36: -1% to +5% (some normalization)
36-month cumulative band (bull case): approximately +12% to +35%.
Bear case projection (more entrants, sustained downward channel pressure)
If additional generics enter or contracting forces downward revisions:
- Months 0–12: -5% to -10%
- Months 12–24: -3% to -7%
- Months 24–36: -2% to -6%
36-month cumulative band (bear case): approximately -10% to -22%.
Where will the “price spread” come from (why list and net prices differ)?
Investors should model both WAC/list and net realized outcomes. In this category:
- WAC can move even when net prices remain muted due to contracting.
- Net realized is often constrained by:
- pharmacy benefit manager and retail chain contracts
- dispensing fees and plan reimbursement rules
- channel-specific discounts
A practical approach is to assume:
- Net realized moves slower than WAC during competitive ramps
- Net realized can move faster during supply shocks if substitution options disappear
What should R&D and commercialization teams monitor to call direction early?
Early warning indicators (high signal)
- NDC activation and deactivation
- A reduction in available NDCs in-stock can predict upward pressure within a quarter.
- Wholesaler availability / fill rate
- Extended backorders correlate with higher realized pricing for remaining sources.
- Retail shelf availability by major chains
- Losing a low-priced SKU often shifts share to higher WAC listings.
Contract and policy signals
- Payer and PBM formulary adjustments for ophthalmic antibiotic ointments
- State-by-state substitution rules impacting pharmacy dispensing
Investment implications: what kind of “asset behavior” this is
Bacitracin-Polymyxin ophthalmic ointment behaves like a:
- low-margin, high-velocity generic legacy product for distributors
- volume-driven product for manufacturers where small unit costs and supply continuity matter
- optionality asset where market pricing depends on active NDC count and supply status, not clinical differentiation
Valuation framework (scenario sizing)
Use a three-variable model:
- Unit volume (demand stability vs substitution)
- Net price (contracted price vs WAC movement)
- COGS and supply yield (yield loss and manufacturing disruption)
Given typical generic category dynamics:
- In bull scenarios, margin improvement depends on both price lift and cost control during constrained production.
- In bear scenarios, volume may hold but net price erosion tends to dominate profit.
Bottom-line price projections
Projected 12-month range: approximately -10% to +15% in realized pricing, depending on supply and channel dynamics.
Projected 36-month range: approximately -22% to +35%.
For planning:
- Base case: -2% to +8% over 36 months.
- Bull case: +12% to +35% over 36 months.
- Bear case: -10% to -22% over 36 months.
Key Takeaways
- Bacitracin-Polymyxin eye ointment is a legacy, multi-source ophthalmic antibiotic combination where price is primarily a function of generic competition and supply availability.
- For the next 12–36 months, realistic realized price movement is mostly flat to moderately moving in the base case, with wide upside in supply shocks and downside under sustained competitive erosion.
- Scenario modeling should focus on active NDC count, availability, and contract-driven net pricing, not just list price.
FAQs
-
What most determines price changes for bacitracin-polymyxin ophthalmic ointment?
Active NDC availability, supply continuity, and channel contracting. Competition compresses net pricing; supply constraints lift it. -
Is the outlook mainly dependent on clinical demand growth?
No. This category is demand-stable but price-sensitive to supply and substitution dynamics. -
How should net price be modeled versus WAC?
Assume net realized prices adjust slower than WAC during competitive changes, but can track faster during supply shortages when fewer alternatives exist. -
What is the most likely 36-month pricing outcome?
Base case: roughly -2% to +8% cumulative realized price change, with a broader range of outcomes depending on supply and NDC count. -
What events would trigger the bull scenario fastest?
Manufacturer supply disruptions, discontinuation of multiple NDCs, and sustained wholesaler backorders that reduce substitution options.
References
[1] FDA. Orange Book: Approved Drug Products with Therapeutic Equivalence Evaluations. U.S. Food and Drug Administration.
[2] FDA. Drug Labeling (publicly available product labeling and ophthalmic antibiotic product information). U.S. Food and Drug Administration.
[3] CMS. National Average Drug Acquisition Cost (NADAC) (data source used to analyze generic price movement patterns). Centers for Medicare & Medicaid Services.
More… ↓
