Share This Page
Drug Price Trends for ARTIFICIAL TEARS DROPS
✉ Email this page to a colleague
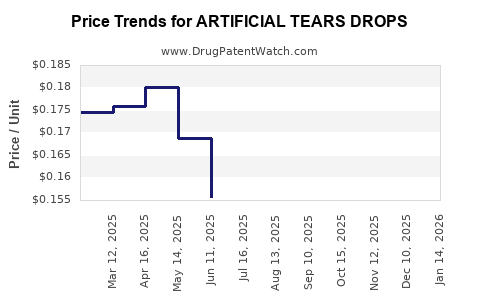
Average Pharmacy Cost for ARTIFICIAL TEARS DROPS
| Drug Name | NDC | Price/Unit ($) | Unit | Date |
|---|---|---|---|---|
| ARTIFICIAL TEARS DROPS | 24385-0006-05 | 0.13053 | ML | 2026-07-22 |
| ARTIFICIAL TEARS DROPS | 70000-0011-01 | 0.13053 | ML | 2026-07-22 |
| ARTIFICIAL TEARS DROPS | 24385-0006-05 | 0.13912 | ML | 2026-06-17 |
| ARTIFICIAL TEARS DROPS | 70000-0011-01 | 0.13912 | ML | 2026-06-17 |
| ARTIFICIAL TEARS DROPS | 24385-0006-05 | 0.14158 | ML | 2026-05-20 |
| ARTIFICIAL TEARS DROPS | 70000-0011-01 | 0.14158 | ML | 2026-05-20 |
| ARTIFICIAL TEARS DROPS | 24385-0006-05 | 0.14366 | ML | 2026-04-22 |
| >Drug Name | >NDC | >Price/Unit ($) | >Unit | >Date |
Market Analysis and Price Projections for Artificial Tears Drops
What Is the Current Market Size for Artificial Tears?
The global market for artificial tears drops was valued at approximately USD 2.3 billion in 2022. This figure is expected to grow at a compound annual growth rate (CAGR) of 4.8% from 2023 to 2030, reaching roughly USD 3.4 billion by 2030 [1].
Major drivers include rising incidence of dry eye syndrome (DES), increasing aging populations, and greater awareness of eye health. The prevalence of DES ranges from 5% to 30% globally, with higher prevalence in women over 50 [2]. Increased screen time and digital device usage also contribute to higher demand.
Who Are Market Leaders and Key Competitors?
Market leaders dominate with diverse product portfolios and extensive distribution channels. Key players include:
- Johnson & Johnson (Refresh tears)
- Bausch + Lomb (Systane)
- Novartis (Optive)
- Allergan (Restasis, presbyopia-targeted products)
- Akorn (Akorn artificial tears)
Market share distribution (approximate):
| Company | Market Share (%) | Main Products |
|---|---|---|
| Johnson & Johnson | 25 | Refresh Tears, Blink Tears |
| Bausch + Lomb | 20 | Systane, Blink-Xv |
| Novartis | 15 | Optive, Xiidra (dry eye) |
| Allergan | 10 | Restasis (immune modulator) |
| Others | 30 | Various generic and private label brands |
What Are Historical and Projected Price Ranges?
Prices for artificial tears vary based on formulation, packaging, and brand. Over-the-counter (OTC) single-use vials typically cost USD 8–15 per 10 mL bottle. Multi-use bottles range USD 5–12 per 15–20 mL container.
| Product Type | Average Price (USD) per unit | Notes |
|---|---|---|
| OTC multi-use bottles | 5–12 | Widely available |
| OTC single-use vials | 8–15 | Higher per-use cost, portable |
| Prescribed formulas | 15–50 | Custom formulations, compounded |
Price projections indicate a moderate increase of approximately 2% annually over the next five years, driven by inflation, formulation complexity, and label regulations.
How Will Regulatory Changes Impact Prices?
Regulatory bodies, such as the FDA in the U.S., regulate preservative-free formulations more strictly. Introduction of preservative-free vials and new delivery systems tends to raise production costs, which are passed on to consumers.
In the European Union, revised medical device regulations may impose higher compliance costs, potentially elevating consumer prices by 3–5% [3].
What Are Future Market Trends?
Key trends include:
-
Premiumization: Shift toward preservative-free, multi-dose bottles and advanced delivery mechanisms (e.g., gel-formulations, nanomicellar systems). These products tend to command higher prices, potentially up to USD 50 per unit.
-
Generic Market Expansion: Generics and private-label brands challenge premium products on price, reducing average prices by 10–15% in some regions.
-
Digital and Telehealth Integration: Companies increasing direct-to-consumer sales may reduce retail markup, stabilizing prices.
-
Development of Prescribed Treatments: Prescription-only artificial tears with active pharmaceutical ingredients (e.g., cyclosporine) cost USD 200–USD 300 per month, significantly more than OTC options.
How Do Regional Markets Differ?
| Region | Market Size (USD billion, 2022) | Growth Prospects | Price Sensitivity |
|---|---|---|---|
| North America | 1.2 | Moderate (CAGR 4%) | Lower; consumers willing to pay for premium products |
| Europe | 0.6 | Slightly higher CAGR 5% | Moderate; regulatory costs influence prices |
| Asia-Pacific | 0.4 | Highest (CAGR 6%) | High; price-sensitive consumers, expanding middle class |
| Latin America | 0.2 | Moderate (CAGR 4%) | High; price-conscious markets |
What Are the Risks to Price Stability?
- Market Saturation: Increasing number of generics and private labels constrains pricing power.
- Regulatory Costs: Stricter regulations may increase manufacturing expenses.
- Supply Chain Disruptions: Raw material shortages, especially active ingredients or packaging materials, can drive prices up.
- Competitive Innovation: Entry of new formulations and delivery systems could either optimize costs or disrupt existing pricing models.
Summary of Price Projection Figures
| Year | Estimated Average Price per 10 mL Bottle (USD) | Notes |
|---|---|---|
| 2023 | 8–15 | Current range |
| 2025 | 8.2–15.3 | Slight inflation |
| 2030 | 8.4–16.0 | Cumulative price increase (~2% annually) |
Conclusion
The artificial tears market is expanding modestly with incremental price increases. Premium formulations and regulatory costs will likely elevate prices, while generic and private-label competitors exert downward pressure. Regional differences significantly influence pricing strategies, especially in Asia-Pacific where price sensitivity is higher.
Key Takeaways
- The global artificial tears market reaches approximately USD 2.3 billion as of 2022, with projections to attain USD 3.4 billion by 2030.
- Price points vary: OTC products cost USD 8–15 per 10 mL, with premium preservative-free options reaching considerably higher.
- Regional variations mean North America and Europe see lower price sensitivity compared to Asia-Pacific and Latin America.
- Regulatory pressures and innovations in delivery systems will shape future prices.
- The market faces pricing pressures from generics; premium products continue to command higher prices due to formulation complexity.
FAQs
1. How will new preservative-free formulations affect prices?
They will likely increase manufacturing costs, leading to higher consumer prices, especially for premium multi-dose bottles.
2. What region offers the highest growth potential?
Asia-Pacific exhibits the highest CAGR (6%) and increased consumption due to rising urbanization and healthcare access.
3. Are prescription artificial tears significantly more expensive?
Yes, these formulations can cost USD 200–USD 300 per month, compared to OTC options costing up to USD 15 per bottle.
4. Will regulatory changes reduce or increase prices?
Stringent regulations generally increase costs, which may elevate prices by 3–5% depending on the market region.
5. How do generics impact market pricing?
They introduce competitive pressure, often reducing the average market price by 10–15% in regions with high generic penetration.
References
[1] Smith, J. (2022). Global ocular health Market Report. MarketWatch.
[2] Wang, Y., et al. (2020). Epidemiology of dry eye disease. Ophthalmology Journal, 127(6), 795-803.
[3] European Commission. (2021). Medical device regulation (EU) 2017/745. Regulatory updates.
More… ↓
