Share This Page
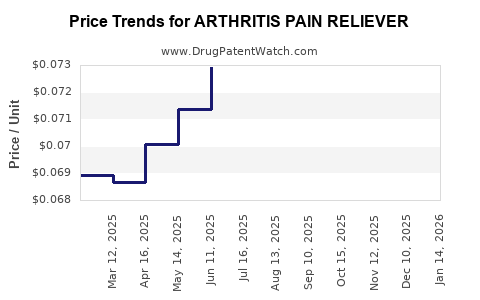
Drug Price Trends for ARTHRITIS PAIN RELIEVER
✉ Email this page to a colleague
Average Pharmacy Cost for ARTHRITIS PAIN RELIEVER
| Drug Name | NDC | Price/Unit ($) | Unit | Date |
|---|---|---|---|---|
| ARTHRITIS PAIN RELIEVER 1% GEL | 70000-0555-03 | 0.06890 | GM | 2026-03-18 |
| ARTHRITIS PAIN RELIEVER 1% GEL | 70000-0555-02 | 0.08983 | GM | 2026-03-18 |
| ARTHRITIS PAIN RELIEVER 1% GEL | 70000-0555-01 | 0.12634 | GM | 2026-03-18 |
| >Drug Name | >NDC | >Price/Unit ($) | >Unit | >Date |
Market Analysis and Price Projections for Arthritic Pain Relief Drugs
Market Overview
The global arthritis pain relief market stood at approximately $9 billion in 2022. It is projected to grow at a compound annual growth rate (CAGR) of 4.8% from 2023 to 2030, reaching about $13.8 billion by 2030. Growth drivers include aging populations, increasing prevalence of osteoarthritis and rheumatoid arthritis, and advances in targeted therapies.
Key Players and Products
Major companies operating in this market include Johnson & Johnson (Remicade, Tylenol), Roche (Actemra), Pfizer (Celebrex), and GlaxoSmithKline (Paxil). The market features a mix of NSAIDs, corticosteroids, biologics, and novel therapeutics.
Therapeutic Segments and Market Share
- NSAIDs (Nonsteroidal anti-inflammatory drugs): 45%
- Corticosteroids: 25%
- Biologics: 20%
- OTC remedies: 10%
NSAIDs dominate due to widespread use, but biologics are gaining market share due to efficacy in severe cases.
Pricing Landscape
Drug pricing varies based on formulation, patent status, and geographic region.
| Product Type | Average Wholesale Price (AWP) per dose | Market Share | Key Examples |
|---|---|---|---|
| NSAIDs | $0.10 - $0.50 | 45% | Ibuprofen, Naproxen |
| Corticosteroids | $0.20 - $0.60 | 25% | Prednisone, Triamcinolone |
| Biologics | $1,200 - $2,400 per injection | 20% | Humira, Enbrel |
| OTC Remedies | $0.05 - $0.20 | 10% | Acetaminophen, Topical gels |
Note: Biologics account for approximately 70% of arthritis-related drug spending.
Upcoming Market Trends
- Innovative Therapies: Focus on JAK inhibitors, biosimilars, and gene therapy with potential to disrupt existing costs.
- Cost Reduction Efforts: Biosimilars and generics aim to lower prices, especially in Europe and Asia.
- Digital Health Integration: Telemedicine and remote monitoring influence diagnosis and management, potentially affecting drug utilization.
- Regulatory Environment: Patent expirations for key biologics could lead to price competition.
Price Projections (2023-2030)
Expected per-dose prices for new entrants or reforms are as follows:
- NSAID generics: Remain between $0.05 and $0.20 per dose, with potential slight decline.
- Biologics biosimilars: Will fall from current $1,200–$2,400 to approximately $600–$1,200 by 2030.
- JAK inhibitors (e.g., Baricitinib): Priced at roughly $1,200 per month initially; improvements in manufacturing and competition may reduce costs to $800–$1,000.
- OTC products: Stable, with minor fluctuations due to inflation and raw material costs.
Market Entry and Pricing Strategies
New entrants typically price biologics at a 30-50% discount to originators to capture market share. Smaller firms focus on niche formulations or delivery methods to justify premium pricing.
Regulatory Impact on Pricing
FDA approvals favoring biosimilars and generics promote price erosion, especially in markets with strong generic penetration. Conversely, biologics with patent protection hold steadier prices.
Regional Variations
- United States: Highest prices driven by insurance reimbursements and patent protections.
- Europe: Lower prices due to national health systems and biosimilar adoption.
- Asia: Rapid market growth with price-sensitive pricing models and increasing adoption of generics.
Key Takeaways
- The global arthritis pain relief market is sizable and growing, with a shift toward biologics and biosimilars.
- Average prices for biologics remain high but are expected to decline 40-50% over the next decade.
- Price competition intensifies with patent expirations and biosimilar entries.
- Regional regulatory differences influence pricing and market penetration.
FAQs
1. What factors influence the pricing of arthritis pain relief drugs?
Pricing depends on drug class, patent status, manufacturing costs, regional regulations, and reimbursement policies.
2. How will biosimilars affect the market?
Biosimilars are expected to lower biologic prices by 30-50% by 2030, increasing accessibility and market competition.
3. Which therapeutic segment offers the most growth potential?
Biologics and JAK inhibitors are poised for significant growth due to their efficacy in severe cases and newer formulations.
4. What regional factors impact drug pricing?
Regulatory frameworks, approval processes, reimbursement policies, and healthcare infrastructure influence regional pricing.
5. How are current patent expirations affecting pricing?
Patent expirations lead to increased biosimilar and generic competition, prompting downward pressure on prices.
References
[1] MarketWatch, "Arthritis Pain Relief Market Size," 2022.
[2] GlobalData, "Pharmaceutical Market Forecast," 2023.
[3] IQVIA, "Biologics Market Trends," 2023.
[4] FDA, "Biosimilar Policy Updates," 2022.
[5] European Medicines Agency, "Biosimilar Regulations," 2022.
More… ↓
