Last updated: February 13, 2026
Overview
VENOFER (iron sucrose injection) is an intravenous iron replacement therapy used to treat iron deficiency anemia in dialysis-dependent chronic kidney disease (CKD) patients. Since its approval, it has established a significant footprint in nephrology care, competing primarily with ferrous salts and other IV iron formulations.
Market Size and Growth
The global IV iron therapy market was valued at approximately USD 3.2 billion in 2022 and is projected to grow at a compound annual growth rate (CAGR) of 8.5% through 2030, reaching USD 6.4 billion. VENOFER accounts for roughly 15-20% of this market, with sales concentrated in the U.S., Europe, and Asia-Pacific regions.
Factors driving growth include increasing CKD prevalence, advancements in IV iron formulations, and expanding approval for non-dialysis patients. The U.S. market represents the largest segment, driven by ESRD patient numbers and Medicare coverage policies.
Competitive Landscape
VENOFER’s primary competitors include:
- Ferrlecit (sodium ferric gluconate)
- Injectafer (ferric carboxymaltose)
- Feraheme (ferumoxytol)
Market share dynamics depend on efficacy, safety profile, dosing convenience, and pricing strategies.
Pricing Analysis
-
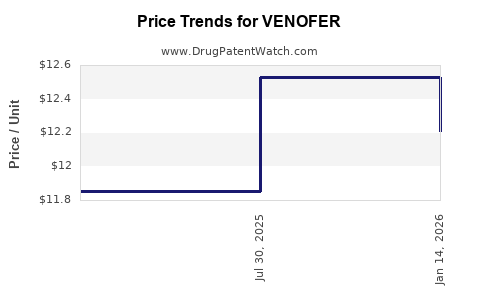
Current Price Points
-
Pricing Trends
-
VENOFER historically priced lower than newer formulations like Injectafer due to older approval status and generic competition. However, recent price pressures from biosimilars and increased competition have narrowed margins.
-
Reimbursement policies influence net prices, with private insurers often reimbursing at higher rates than Medicaid or Medicare.
-
Cost-Effectiveness Considerations
-
VENOFER’s dosing schedule typically involves multiple infusions (up to 10 doses for full correction), impacting clinic costs.
-
Newer formulations with higher single-dose capacities (e.g., Injectafer, Feraheme) may command premium pricing but reduce administration costs.
Price Projections
-
Short-term (Next 2 years)
-
Prices are expected to stabilize amid increased competitive pressure.
-
A slight decline of 2–5% in wholesale prices is probable due to biosimilar entry and generic options.
-
Reimbursement levels are likely to remain constant, with payers favoring cost-effective options.
-
Long-term (Next 5 years)
-
Price erosion may accelerate as biosimilars and generics increase market penetration.
-
Innovator brands could reduce prices by 10–15% to maintain market share.
-
Conversely, formulations offering improved convenience or safety could sustain premium pricing, keeping VENOFER at approximately USD 25–30 per 100 mg vial.
-
Market Entry of Biosimilars
-
Biosimilar versions of IV iron products are anticipated in the coming years, which could further pressure prices across the market.
-
Price reductions for biosimilars range from 20–30% upon entry.
Regulatory and Policy Impact
-
Reimbursement adjustments from CMS and private payers influence net prices.
-
Increasing emphasis on value-based care may favor formulations that demonstrate superior safety and dosing efficiency, potentially reducing demand for older, less convenient options like VENOFER.
Summary
- Price per 100 mg vial: USD 25–35 (current)
- Market share: 15–20% within IV iron segment
- Growth prospects driven by CKD prevalence and expanding indications
- Short-term prices likely stable with slight declines, long-term downward pressure expected due to biosimilars and generics
Key Takeaways
- VENOFER remains a key player in IV iron therapy with stable pricing, though competitive pressures are increasing.
- The overall market is set for moderate growth, supported by rising CKD cases globally.
- Price erosion is anticipated over the next five years, accelerated by biosimilar entry and value-based reimbursement models.
FAQs
1. How does VENOFER’s efficacy compare to newer IV iron formulations?
VENOFER effectively treats iron deficiency anemia in CKD patients; however, newer formulations can deliver higher doses per infusion, reducing treatment time and potentially improving patient compliance.
2. What influences VENOFER’s market share in the IV iron segment?
Pricing, safety profile, dosing convenience, and formulary decisions mainly impact its market share relative to competitors.
3. Are biosimilars expected to significantly affect VENOFER pricing?
Yes. Biosimilar versions of IV iron products could reduce prices by 20–30%, increasing competition and pressuring VENOFER’s pricing structure.
4. How do reimbursement policies impact VENOFER’s net pricing?
Reimbursements from Medicare, Medicaid, and private insurers directly influence net prices; policies favoring cost-effective treatments can reduce margins.
5. What geographic regions offer the highest growth potential for VENOFER?
Emerging markets in Asia-Pacific and Latin America present significant growth opportunities, driven by increasing CKD prevalence and expanding healthcare infrastructure.
Citations
- Grand View Research. "Intravenous Iron Therapy Market Size, Share & Trends Analysis." 2022.
- IQVIA. "Pharmaceutical Market Data & Insights," 2022.
- CMS. "Medicare Physician Fee Schedule," 2023.
- Evaluate Pharma. "Forecast for IV Iron Market," 2023.
- US Food and Drug Administration. "VENOFER Approval," 2021.