Share This Page
Drug Price Trends for SM HYDROGEN PEROXIDE
✉ Email this page to a colleague
Average Pharmacy Cost for SM HYDROGEN PEROXIDE
| Drug Name | NDC | Price/Unit ($) | Unit | Date |
|---|---|---|---|---|
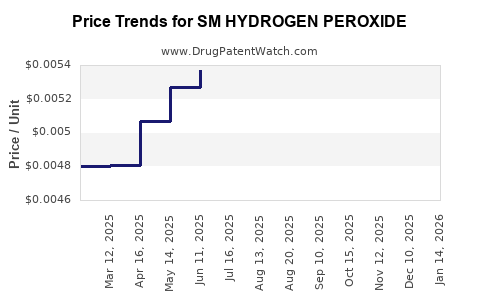
| SM HYDROGEN PEROXIDE 3% SOLN | 49348-0179-38 | 0.01814 | ML | 2026-03-18 |
| SM HYDROGEN PEROXIDE 3% SOLN | 49348-0179-38 | 0.01856 | ML | 2026-02-18 |
| SM HYDROGEN PEROXIDE 3% SOLN | 49348-0179-38 | 0.01915 | ML | 2026-01-21 |
| >Drug Name | >NDC | >Price/Unit ($) | >Unit | >Date |
Market Analysis and Price Projections for SM Hydrogen Peroxide
What is SM Hydrogen Peroxide and Its Market Position?
SM Hydrogen Peroxide (stabilized or specialty-grade hydrogen peroxide) is an industrial chemical used primarily in sectors such as pulp and paper, textile bleaching, water treatment, electronics, and healthcare sterilization. Its high purity and stability distinguish it from standard grades used in cleaning or household applications.
Current global market size is estimated at approximately USD 1.2 billion in 2022, with compound annual growth rate (CAGR) projections of 4.8% from 2023 to 2030. Industry demand is driven by increasing water treatment needs, growth in pulp and paper production, and healthcare disinfectant applications.
Key Market Drivers
- Healthcare Industry Expansion: Increased demand for sterilization agents spurred by global health crises.
- Industrial Growth: Rising pulp and paper production, especially in Asia-Pacific.
- Water Treatment: Government mandates for water purification in urban and rural areas.
- Electronics Manufacturing: Need for cleaning agents using high-purity hydrogen peroxide.
Competitive Landscape
Major producers include:
| Company | Production Capacity | Market Share (est.) | Key Markets |
|---|---|---|---|
| Nouryon (AkzoNobel) | 600,000+ tons/year | 40% | Europe, North America |
| Solvay | 300,000+ tons/year | 20% | Europe, Asia |
| Evonik Industries | 200,000+ tons/year | 10% | Global |
| Others | 200,000+ tons/year | 30% | Emerging markets |
Consolidation among producers has stabilized pricing, but regional supply-demand dynamics influence prices.
Price Trends and Projections
Current Pricing
- Average FOB Asia-Pacific: USD 1.20–1.50 per kg (2022).
- North America: USD 1.50–1.80 per kg.
- Europe: USD 1.30–1.70 per kg.
Historical Pricing Trends
Price peaked in 2018 at USD 2.00 per kg, then declined due to overcapacity, reaching USD 1.20 in 2020. Post-pandemic recovery and capacity adjustments pushed prices upward again.
Price Forecast (2023–2030)
| Year | Estimated Price Range (USD per kg) | Drivers |
|---|---|---|
| 2023 | 1.40–1.65 | Capacity stabilization, increased demand in water treatment |
| 2025 | 1.55–1.80 | Expanding healthcare sterilization, growth in pulp industry |
| 2030 | 1.75–2.00 | Continued industrialization, supply tightness in key regions |
The most significant factors influencing prices include raw material costs (e.g., oxygen, hydrogen), energy prices, and environmental regulations affecting production costs.
Supply Chain and Cost Factors
- Raw Materials: Hydrogen and oxygen are essential, with prices affected by energy markets.
- Production Methods: Anthraquinone process dominates; newer methods aim for lower emissions.
- Environmental Regulations: Stricter emissions standards in the EU and North America increase production costs.
Policy and Regulatory Impact
- EU and US regulations favor cleaner production processes, potentially raising costs.
- Import tariffs and trade policies influence regional pricing disparities.
Strategic Implications
- Producers focus on specialty-grade hydrogen peroxide for decontamination and electronics, which command higher margins.
- Regional capacity expansions aim to meet rising demand in Asia-Pacific.
- Price volatility remains a risk due to raw material fluctuations and regulatory shifts.
Key Takeaways
- The global hydrogen peroxide market is expanding at nearly 5% annually.
- Prices are influenced by capacity utilization, regional demand, and input costs.
- Asia-Pacific leads growth, driven by urbanization and industrialization.
- Volatility persists with raw material prices and regulatory policies.
- Market players focus on specialty-grade products to improve margins amid competitive pressure.
Frequently Asked Questions
1. What factors most influence hydrogen peroxide prices?
Raw material costs, energy prices, production capacity, regional demand shifts, and regulatory compliance costs.
2. How does regulation affect the SM hydrogen peroxide market?
Environmental standards increase production costs and may restrict certain manufacturing processes, influencing overall pricing.
3. What key growth regions are expected for hydrogen peroxide?
Asia-Pacific, due to urbanization, industrial growth, and infrastructure investments.
4. How does demand in healthcare impact the market?
Expanded sterilization needs, especially during health crises, drive higher consumption and prices.
5. Are there new technologies affecting supply and pricing?
Yes, innovations in production aiming to reduce environmental impact could alter supply dynamics and costs.
References
- Allied Market Research. (2022). Hydrogen Peroxide Market Size, Share & Trends Analysis. Retrieved from https://www.alliedmarketresearch.com/hydrogen-peroxide-market
- MarketsandMarkets. (2022). Hydrogen Peroxide Market by Grade, Application, and Region. Retrieved from https://www.marketsandmarkets.com/market-report/hydrogen-peroxide-market
- Nouryon. (2022). Company Overview. Retrieved from https://www.nouryon.com
- U.S. Energy Information Administration. (2022). Global fuel and energy prices. Retrieved from https://www.eia.gov
More… ↓
