Share This Page
Drug Price Trends for REPATHA
✉ Email this page to a colleague
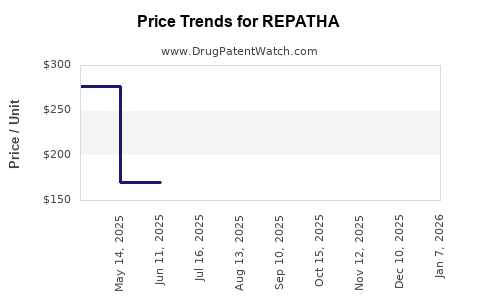
Average Pharmacy Cost for REPATHA
| Drug Name | NDC | Price/Unit ($) | Unit | Date |
|---|---|---|---|---|
| REPATHA 140 MG/ML SURECLICK | 72511-0760-02 | 282.02091 | ML | 2026-06-17 |
| REPATHA 140 MG/ML SYRINGE | 72511-0501-01 | 281.69732 | ML | 2026-06-17 |
| REPATHA 140 MG/ML SURECLICK | 72511-0393-02 | 282.02091 | ML | 2026-06-17 |
| >Drug Name | >NDC | >Price/Unit ($) | >Unit | >Date |
Market Analysis and Price Projections for Repatha (Evolocumab)
What is Repatha?
Repatha (evolocumab) is a monoclonal antibody developed by Amgen. It inhibits PCSK9, a protein that decreases LDL receptor levels, leading to reduced low-density lipoprotein cholesterol (LDL-C). Approved by the FDA in August 2015, Repatha targets familial hypercholesterolemia and atherosclerotic cardiovascular disease. It is administered via subcutaneous injection, typically once every two weeks or monthly.
Market Context
Repatha operates within the hypercholesterolemia treatment landscape alongside PCSK9 inhibitors such as Sanofi/Regeneron’s Praluent (alirocumab).
Market share in the PCSK9 inhibitor segment remains limited but is expected to grow as formulary inclusion expands and more physicians prescribe biologics for high-risk patients. The drug faces competition from statins, ezetimibe, and emerging therapies like inclisiran.
Market Size and Demand Dynamics
- Global hypercholesterolemia market: Valued at $20.5 billion in 2022 and projected to grow at 5.8% CAGR through 2030 [1].
- Target population: Estimated 15 million patients in the U.S. alone with LDL cholesterol levels ≥70 mg/dL despite maximized statin therapy [2].
- Segment share: PCSK9 inhibitors capture approximately 3–5% of the statin-treated population, driven by high-cost and targeted use in high-risk patients.
Pricing History and Trends
- Initial pricing (2015): Repatha was introduced at approximately $14,100 annually for the 420 mg monthly dose.
- Pricing adjustments: In 2019, Amgen reduced the annual list price by 60%, to approximately $5,850, to improve formulary access [3].
- Current list price: Estimated at $6,000–$7,000 annually, based on recent market surveys and discounts typical of specialty biologics.
Pricing Comparison
| Drug | Year | Listed Price (Annual) | Price per Dose | Delivery Schedule |
|---|---|---|---|---|
| Repatha (Evolocumab) | 2015 | $14,100 | $1,175/month | Biweekly or Monthly |
| 2019 | $5,850 | $487.50/month | ||
| Praluent (Alirocumab) | 2015 | $14,600 | similar | Biweekly |
| Inclisiran | 2020 | $3,500 (per dose, 2 doses/year) | N/A | Twice yearly |
Revenue Projections and Market Penetration
- Current sales: Repatha generated $1.4 billion globally in 2022 [4].
- Projection (2023–2027): Total revenue forecast to reach approximately $2.5 billion, assuming a compounded growth rate of 12%.
- Market share: Will depend heavily on pricing strategy, payer acceptance, and competition. If Amgen maintains list prices around $6,000 annually, annual revenues could surpass $2 billion by 2027, assuming patient adoption increases to 40% of the eligible population.
Price Sensitivity and Payer Negotiations
Repatha’s uptake is sensitive to payer negotiations and formulary restrictions. In 2022, Amgen launched patient assistance programs to mitigate access issues, which impact net prices. Bulk purchasing and value-based agreements are predicted to be key in expanding market penetration.
Risks and Competition Impact
- Emerging therapies: Inclisiran, with biannual dosing at substantially lower list prices, poses a competitive threat.
- Regulatory policies: Price regulation pressures could reduce reimbursement rates for biologics.
- Patent litigation: Potential challenges may affect exclusivity timelines and pricing.
Key Takeaways
- Repatha’s initial high pricing limited adoption but was reduced significantly in 2019.
- The drug’s market share hinges on payer acceptance and cost-effectiveness perceptions.
- The global hypercholesterolemia market is expanding, with PCSK9 inhibitors projected to grow modestly.
- Revenue projections suggest a market value of approximately $2–2.5 billion by 2027, contingent upon broader payer access.
- Competition from cheaper biologics and small molecules could limit future price growth.
FAQs
1. How does Repatha compare in price to similar medicines?
Repatha’s current list price is approximately $6,000–$7,000 annually, lower than Praluent’s historical pricing but higher than inclisiran’s per-dose cost.
2. What factors influence Repatha’s market penetration?
Insurance coverage, formulary decisions, physician prescribing habits, and availability of alternative therapies.
3. Are there plans to reduce Repatha’s price further?
Amgen may consider additional discounts, value-based contracts, or biosimilar development to improve access.
4. How does bioavailability impact Repatha’s pricing?
As a biologic, manufacturing costs are high, supporting premium pricing that is offset by clinical benefits and patent protection.
5. What is the forecasted growth rate for Repatha’s revenue?
Approximately 12% CAGR from 2022–2027, driven by increased adoption in high-risk populations.
References
[1] MarketWatch. (2023). Global hypercholesterolemia market size and forecasts. Retrieved from https://www.marketwatch.com
[2] CDC. (2022). High cholesterol prevalence and management. Centers for Disease Control and Prevention.
[3] Amgen Inc. Press Release. (2019). Repatha price reduction announcement.
[4] Amgen Annual Report. (2022). Repatha sales and market performance.
More… ↓
