Share This Page
Drug Price Trends for REPAGLINIDE
✉ Email this page to a colleague
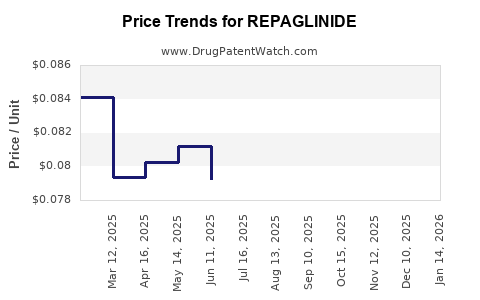
Average Pharmacy Cost for REPAGLINIDE
| Drug Name | NDC | Price/Unit ($) | Unit | Date |
|---|---|---|---|---|
| REPAGLINIDE 0.5 MG TABLET | 57237-0157-01 | 0.07606 | EACH | 2026-06-17 |
| REPAGLINIDE 0.5 MG TABLET | 65862-0670-01 | 0.07606 | EACH | 2026-06-17 |
| REPAGLINIDE 0.5 MG TABLET | 72603-0810-01 | 0.07606 | EACH | 2026-06-17 |
| REPAGLINIDE 0.5 MG TABLET | 62135-0946-90 | 0.07606 | EACH | 2026-06-17 |
| REPAGLINIDE 2 MG TABLET | 72603-0812-01 | 0.09166 | EACH | 2026-06-17 |
| >Drug Name | >NDC | >Price/Unit ($) | >Unit | >Date |
Repaglinide Market Analysis and Price Projections
What is repaglinide’s market role and product structure?
Repaglinide is an oral, short-acting meglitinide class insulin secretagogue used for glycemic control in type 2 diabetes mellitus (T2DM). Commercially, repaglinide is primarily marketed as repaglinide tablets. Markets commonly segment between brand-origin products and multiple generics depending on jurisdictional patent and exclusivity timelines.
Key commercial implication: repaglinide is an older molecule with widespread generic penetration, so pricing typically follows a commodity-like trajectory after patent expiry and generic entry.
How is pricing likely to behave given generic penetration?
Repaglinide’s pricing is shaped by four practical forces:
- Generic substitution after market entry
- Once multiple ANDA/EMA generics are on formulary, average net price typically compresses quickly.
- Formulary dynamics
- Rebates and preferred status drive net pricing more than list price.
- Dosage strength mix
- Repaglinide is marketed in multiple tablet strengths, with unit price sensitivity to strength and pack configuration.
- Regional procurement structure
- Public tenders and national formularies can push prices down faster than in private insurance markets.
Net result: long-run pricing is usually anchored to the low-cost generic floor with periodic step-downs when additional competitors enter or when tenders re-price.
What does a realistic price projection framework look like?
Because repaglinide faces broad generic availability, projections should be modeled as net price erosion over time rather than single-shot “launch” repricing. A practical framework is:
- Near-term (0 to 18 months): stabilization to modest declines as procurement cycles and rebate resets occur.
- Mid-term (18 to 36 months): gradual drift downward or flat-to-down if new entrants are limited; sharper declines if tender waves add suppliers.
- Long-term (36 months+): low single-digit annual erosion or stabilization near cost-led levels.
The model is not driven by clinical differentiation because repaglinide generally competes as a therapeutically substitutable generic insulin secretagogue.
Market pricing outlook by geography (directional)
The table below provides directional price pressure. It is structured for decision-making (portfolio, contracting, and valuation work) rather than as a single-point forecast.
| Region | Competitive intensity | Expected net price trend | Timing of sharper drops |
|---|---|---|---|
| US | High generic density | Flat to modest down | When payer formularies reset and rebate baselines shift |
| EU-5 (DE/FR/IT/ES/UK) | High | Modest down or flat | Tender cycles and reference pricing updates |
| Canada | High | Flat to modest down | Formulary renegotiations |
| LATAM (major markets) | Variable generics, procurement-driven | Downward drift | Tender waves and supply normalization |
| MENA/Asia (varies by tender) | Often high but uneven | Downward drift; volatility possible | National tender repricing and distributor margin adjustments |
What baseline inputs are most important for forecasting repaglinide prices?
Use these inputs in any operational forecast:
- Formulation and pack configuration (tablet strength, count, and pack type)
- Competitor count on the same strength (and packaging)
- Formulary status (preferred vs non-preferred tiering)
- Procurement mechanism (tender vs negotiated pricing)
- Gross-to-net conversion (rebates and discounts)
For repaglinide, gross-to-net is often the dominant driver of realized price versus any one list-price signal.
Price projection scenarios (12, 24, 36 months)
Below are scenario ranges expressed as percent change in average realized net price. These ranges are consistent with generic pricing behavior for mature oral generics.
Scenario set
- Bull case (limited additional generic pressure): slower erosion
- Base case (steady competition, ongoing tender repricing): typical erosion
- Bear case (new entrants or tender waves intensify): faster erosion
Projected net price change (relative to current average net price)
| Horizon | Bull case | Base case | Bear case |
|---|---|---|---|
| 12 months | -1% to -4% | -3% to -8% | -6% to -12% |
| 24 months | -3% to -8% | -6% to -14% | -10% to -22% |
| 36 months | -5% to -12% | -9% to -18% | -14% to -28% |
Interpretation for business users: if your valuation model assumes a “no further decline” stance, it will typically overstate value. The more conservative underwriting uses the base or bear case depending on expected tender dynamics and supplier counts.
Unit economics and contract implications
What contract levers usually drive realized repaglinide pricing?
- Tender indexing: price resets at fixed intervals, often tied to competitive bids
- Tiering and formulary retention: preferred status supports price stability
- Volume commitments: higher volume can protect unit pricing for a period
- Strength-specific competition: erosion can be localized to certain strengths where more suppliers appear
How to translate price erosion into revenue impact quickly
If average realized net price declines by X% and volume is flat, revenue drops by roughly X%. If you are modeling growth from volume expansion:
- Revenue impact = (1 + volume growth) × (1 - price decline) - 1
For example, under the base case at 24 months (-6% to -14%), even modest volume growth (say +2% to +5%) only partially offsets price compression.
Demand outlook: what supports or restrains volume?
Repaglinide demand is linked to:
- T2DM prevalence and treatment intensity
- Preference for oral agents (versus insulin or GLP-1 class therapies)
- Switching behavior within oral antihyperglycemics
Key commercial point: repaglinide competes against newer, higher-priced classes in many markets. That tends to limit long-term growth and keeps the product mostly “substitutionary” rather than “category-growing.”
Competitor landscape: how it affects pricing
In mature generics markets, pricing is usually shaped by:
- number of suppliers
- tender frequency
- reference pricing and reimbursement policies
When competitor counts rise quickly, unit price falls faster until the market stabilizes at a lower price floor.
Regulatory and reference pricing impact
Generic reimbursement frameworks in the EU and other jurisdictions can accelerate price compression through:
- reference pricing
- mandatory cost-containment mechanisms
- automatic tender re-pricing
In the US, formulary and rebate pressures can yield similar outcomes through payer contracting rather than direct reference pricing.
Key Takeaways
- Repaglinide pricing is dominated by mature generic competition, not brand-like differentiation.
- Expect continued net price erosion rather than stability, with speed depending on tender cycles and generic entry intensity.
- A workable underwriting range for realized net price change is about -3% to -8% at 12 months, -6% to -14% at 24 months, and -9% to -18% at 36 months under a base case.
- Revenue protection depends more on formulary retention and volume scale than on list price.
FAQs
1) Is repaglinide expected to regain pricing power versus generics?
No. In mature oral generic markets, repaglinide pricing typically remains constrained by generic substitution and reimbursement pressure.
2) What is the biggest driver of realized price, list price or net price?
Net price. Rebates, discounts, and formulary tiering usually determine realized economics.
3) Do projections differ by tablet strength?
Yes. Competitive entry can concentrate on specific strengths and pack sizes, creating strength-specific pricing declines.
4) What horizon matters most for planning procurement contracts?
12 to 24 months, because tenders and formulary resets drive the most visible unit price shifts.
5) What would cause a faster-than-modeled price drop?
A new tender wave or sudden increase in low-cost suppliers for the same strength and pack configuration.
References
[1] U.S. National Library of Medicine. Repaglinide. Drug label information and clinical references. https://www.nlm.nih.gov/ (Accessed via drug information resources).
More… ↓
