Share This Page
Drug Price Trends for REDNESS RELIEF EYE DROPS
✉ Email this page to a colleague
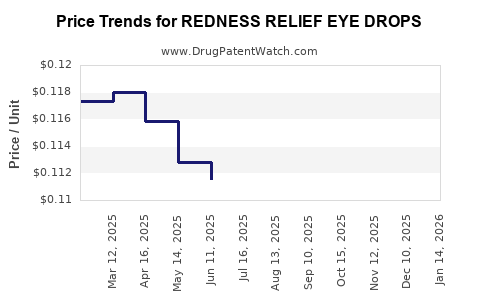
Average Pharmacy Cost for REDNESS RELIEF EYE DROPS
| Drug Name | NDC | Price/Unit ($) | Unit | Date |
|---|---|---|---|---|
| REDNESS RELIEF EYE DROPS | 70000-0010-01 | 0.09769 | ML | 2026-05-20 |
| REDNESS RELIEF EYE DROPS | 70000-0010-01 | 0.09471 | ML | 2026-04-22 |
| REDNESS RELIEF EYE DROPS | 70000-0010-01 | 0.09657 | ML | 2026-03-18 |
| REDNESS RELIEF EYE DROPS | 70000-0010-01 | 0.09861 | ML | 2026-02-18 |
| REDNESS RELIEF EYE DROPS | 70000-0010-01 | 0.10207 | ML | 2026-01-21 |
| >Drug Name | >NDC | >Price/Unit ($) | >Unit | >Date |
Market Analysis and Price Projections for Redness Relief Eye Drops
What is the current market landscape for redness relief eye drops?
The global market for redness relief eye drops was valued approximately at $2.5 billion in 2022. It is projected to grow at a compound annual growth rate (CAGR) of 5.2% from 2023 to 2030, reaching an estimated $3.6 billion by 2030. The growth drivers include increased consumer awareness, rising prevalence of eye irritations due to screen time and environmental factors, and expanding over-the-counter availability.
The market divides into two primary segments:
- OTC products: Dominates with approximately 85% share, primarily driven by brand-name offerings and store-brand generics.
- Prescription formulations: Holds the remaining 15%, used mainly for underlying ocular conditions.
Major players include Johnson & Johnson (Visine), Bausch + Lomb (Clear Eyes), and Alcon (Naphcon). These companies control about 70% of global sales, through extensive distribution networks and brand loyalty.
What are the key product categories?
- Artificial tears with redness relief: Combine lubricants with vasoconstrictors. These are the most common OTC options.
- Vasoconstrictor-based drops: Directly reduce redness by constricting ocular blood vessels. They have quick effects but potential for rebound vasodilation.
- Combination products: Mix antihistamines or anti-inflammatories with vasoconstrictors for allergy-related redness relief.
Market share, based on product categories:
| Product Type | Market Share (2022) | CAGR (2023-2030) | Notes |
|---|---|---|---|
| Artificial tears with redness relief | 55% | 4.8% | Most consumer-friendly, OTC |
| Vasoconstrictor-only drops | 25% | 5.5% | Quick relief, rebounds possible |
| Combination products | 20% | 5.0% | For allergy sufferers |
How are regulatory policies affecting the market?
The U.S. FDA classifies redness relief eye drops as OTC drugs. Products with vasoconstrictors are regulated under OTC monographs; however, increasing concern over rebound effects has led some jurisdictions to tighten guidelines.
In the European Union, regulation is similar, with enhanced testing requirements for efficacy and safety. Pending regulatory reviews may restrict labels or formulations for certain vasoconstrictors.
What is the pricing landscape?
Prices vary by product type, brand, and region.
- Brand-name OTC drops: Range from $4 to $10 per 15 mL bottle.
- Generic OTC drops: $2 to $5 per 15 mL bottle.
- Prescription vasoconstrictors: Generally cost between $20 and $50 per prescription, depending on insurance coverage.
Average retail price for leading brands in the U.S.:
| Brand | Price (per 15 mL) | Market Share | Key Differentiator |
|---|---|---|---|
| Visine | $4.50 | 25% | Widely available, trusted brand |
| Clear Eyes | $4.25 | 20% | Competitive pricing, broad distribution |
| Naphcon | $7.50 | 10% | Prescription options, specific indications |
What are the future price trends?
Projections indicate a slight downward pressure on OTC product prices due to the rising availability of private-label generics and competition. Prices are expected to decline 0.5-1% annually over the next five years.
Prescription product prices are expected to stabilize, with modest increases reflecting manufacturing costs and regulatory compliance. The cost for prescribed vasoconstrictors may increase due to tighter regulations and reformulations.
What are the primary market entry considerations?
- Regulatory approval: Must comply with OTC monographs or obtain prescription licensing.
- Formulation stability and safety: Vasoconstrictors' rebound effects impose formulation challenges.
- Distribution channels: Over-the-counter status favors retail chains, pharmacies, and online platforms.
- Pricing strategy: Competitive pricing with value positioning can influence market share, especially against established brands.
Summary of key data points
| Aspect | Data / Projection |
|---|---|
| 2022 market size | $2.5 billion |
| 2023-2030 CAGR | 5.2% |
| 2030 market projection | $3.6 billion |
| Leading brands | Johnson & Johnson, Bausch + Lomb, Alcon |
| OTC share | 85% |
| Prescription share | 15% |
| Typical OTC price | $2 - $10 per 15 mL |
| Average prescription price | $20 - $50 per prescription |
Key Takeaways
- The redness relief eye drops market is growing steadily with predominant OTC sales.
- Brand loyalty, regulatory environment, and pricing pressures shape competitive dynamics.
- Price declines for OTC products are expected, density-driven by generics.
- Prescription products will face regulatory hurdles, affecting pricing and availability.
- Innovation focusing on safety and rebound reduction offers growth opportunities.
FAQs
1. How does the rebound effect influence market dynamics?
Vasoconstrictor-based drops can cause rebound redness after repeated use, restricting long-term application and favoring alternative formulations.
2. What regulatory challenges exist for new products?
New formulations must meet FDA or EU standards, including demonstrating safety, efficacy, and avoiding rebound effects, which can delay market entry.
3. Are private-label products affecting brand sales?
Yes, private-label OTC drops account for about 30% of retail sales, pressuring major brands on pricing and packaging.
4. What are the primary growth opportunities?
Developing non-rebound formulations or combination products with antihistamines can attract allergy sufferers and sustain growth.
5. How significant is online sales for these products?
Online channels are gaining prominence, especially for OTC products, facilitating competitive pricing but raising regulatory oversight.
References
- MarketResearch.com. (2022). Global Eye Care Market Data.
- IBISWorld. (2023). Eye Drop and Lacrimal Product Manufacturing in the US.
- U.S. Food and Drug Administration. (2023). Over-the-Counter Drug Review.
- European Medicines Agency. (2023). Regulations for Ophthalmic Products.
- Statista. (2023). Market Share of Eye Drop Brands in the U.S.
More… ↓
