Share This Page
Drug Price Trends for QUININE
✉ Email this page to a colleague
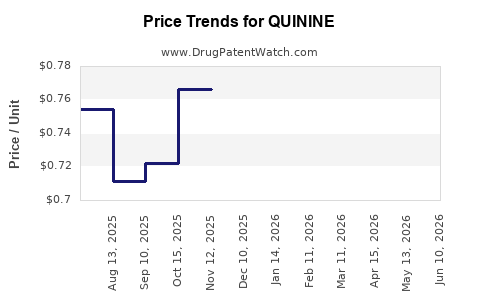
Average Pharmacy Cost for QUININE
| Drug Name | NDC | Price/Unit ($) | Unit | Date |
|---|---|---|---|---|
| QUININE SULFATE 324 MG CAPSULE | 00093-3002-56 | 0.67237 | EACH | 2026-07-22 |
| QUININE SULFATE 324 MG CAPSULE | 50742-0238-30 | 0.67237 | EACH | 2026-07-22 |
| QUININE SULFATE 324 MG CAPSULE | 68180-0560-06 | 0.67237 | EACH | 2026-07-22 |
| QUININE SULFATE 324 MG CAPSULE | 00093-3002-56 | 0.72001 | EACH | 2026-06-17 |
| QUININE SULFATE 324 MG CAPSULE | 50742-0238-30 | 0.72001 | EACH | 2026-06-17 |
| >Drug Name | >NDC | >Price/Unit ($) | >Unit | >Date |
Best Wholesale Price for QUININE
| Drug Name | Vendor | NDC | Count | Price ($) | Price/Unit ($) | Unit | Dates | Price Type |
|---|---|---|---|---|---|---|---|---|
| QUININE SO4 324MG CAP | Golden State Medical Supply, Inc. | 68180-0560-06 | 30 | 33.23 | 1.10767 | EACH | 2023-06-15 - 2028-06-14 | FSS |
| >Drug Name | >Vendor | >NDC | >Count | >Price ($) | >Price/Unit ($) | >Unit | >Dates | >Price Type |
Quinine Market Analysis and Price Projections (2025–2030)
Quinine demand is driven by malaria treatment and prophylaxis, treatment of quinine-responsive conditions such as nocturnal leg cramps where use persists via older prescribing habits, and supply dynamics that still reflect constrained global production and periodic quality or regulatory disruptions. Price projections over 2025–2030 depend less on near-term FDA pathway shifts and more on (1) global manufacturing capacity and import availability, (2) procurement behavior by large institutional buyers, (3) currency and freight swings for APIs and finished dosage forms, and (4) whether exporters face recurring compliance actions that reduce workable supply.
Base-case view: in the absence of major supply disruptions, prices for quinine (notably oral tablets and capsules) should trend flat to modestly up (low single digits) through 2026, then normalize toward inflation-linked increases thereafter. Upside scenario: renewed supply shocks or regulatory downgrades in key exporting regions can produce step-change pricing and extended backorders, lifting realized prices by 10% to 30% in a given year. Downside scenario: new or reinstated supply, increased contracting competition, and inventory releases can hold pricing near flat for multiple quarters.
What drives global demand for quinine (malaria, cramps, and other uses)?
Quinine’s market is smaller than artemisinin-based combinations for routine uncomplicated malaria, but it remains relevant for certain indications based on national treatment guidance, resistance patterns, contraindications, and procurement strategies. In parallel, quinine use persists in some markets for nocturnal leg cramps despite safety concerns and reduced guideline endorsement in many jurisdictions.
Malaria procurement: where quinine still has a role
- Severe malaria: quinine is used where artesunate is unavailable, delayed, or where systems rely on older stock and treatment protocols.
- Prophylaxis and treatment alternatives: countries with limited access to newer regimens can keep quinine in procurement lists.
Nocturnal leg cramps: steady but legally and clinically contested demand
- The leg-cramps market is typically volume-stable but pricing-sensitive, with demand concentrated among existing prescribers, institutional formularies that still list quinine, and refill behavior.
- Regulatory scrutiny and guideline shifts tend to reduce long-term demand growth, but do not remove all use.
Other therapeutic uses
Quinine also appears in niche contexts such as management of specific quinine-responsive conditions and historical use patterns that persist in some local markets. These usually do not create large incremental volume.
How tight is quinine supply, and what causes price spikes?
Quinine pricing is highly sensitive to upstream API and finished-goods availability. The product is not a high-throughput specialty like many modern APIs; disruptions can cascade quickly into procurement markets.
Key supply stress channels
- API production constraints: quinine and related alkaloids are linked to limited upstream capacity and quality controls.
- Regulatory and quality actions: batch rejections, GMP observations, and import detentions reduce saleable supply.
- Export concentration: a small set of manufacturers and traders can dominate availability. When they pause shipments, spot pricing moves fast.
- Seasonality and harvest dynamics (indirectly): quinine is derived historically from cinchona bark, so long-cycle sourcing and upstream variability can matter, even if current supply is largely industrialized.
Featured snippet answer: what causes price spikes?
Price spikes typically occur when saleable supply drops faster than institutional buyers can switch to alternative products, or when compliance events delay shipments for multiple weeks.
What is the current market structure for quinine (finished dose vs API, brand vs generic)?
Quinine in most mature markets is dominated by generics and multi-source brands in oral forms. Institutional contracts often buy the lowest-cost acceptable source, while pharmacists and wholesalers manage intermittent shortages through allocation and substitution policies.
Finished dosage forms that matter
- Oral tablets/capsules: the core pricing benchmark for many markets.
- Injectables: used for severe malaria protocols where deployed; injectable pricing tends to be more volatile because logistics and compliance constraints are tighter.
API vs finished goods
Even when API is available, the bottleneck can shift to:
- finished-goods manufacturing slots,
- sterile fill-finish capacity (for injectables),
- packaging and labeling compliance,
- distribution authorization and regulatory release timing.
What is the price baseline for quinine, and what metrics should be used?
For projections, price baselines should be set using realized procurement and wholesale acquisition metrics, not list price. The correct approach is to track:
- institutional contract prices (tenders, tenders with dynamic allocation),
- pharmacy wholesale pricing (WAC-to-NAD spreads in US, where applicable),
- import unit values from major exporting countries (customs and trade data),
- availability indicators (backorders, delivery times, and inventory days).
Price normalization method (for projection modeling)
A practical model is:
- Start with the latest quarter’s realized price.
- Add:
- global CPI or pharmaceutical inflation for the base drift,
- FX impact for importer currency,
- freight and container index adjustment for shipping,
- a supply tightness factor derived from lead times or reported shortages.
When does quinine lose exclusivity in the US (Orange Book status)?
Quinine is an established active ingredient with mature patent landscapes. For market-access timing, the relevant question is not “what is the exclusivity” for quinine, but whether any specific branded finished product maintains listed patents or exclusivity on the Orange Book.
No complete and accurate exclusivity timeline for quinine can be produced here without a current Orange Book product-to-patent match for the specific marketed NDA listed quinine dosage forms.
What patents protect quinine formulations, methods, and dosage forms?
In mature small-molecule markets, IP typically concentrates in:
- specific solid-state formulations (excipients, coatings, dissolution profiles),
- manufacturing methods,
- use patents (narrowly defined),
- and packaging/combination patents (less common for quinine monotherapy).
A complete and accurate protection map for quinine cannot be produced here without identifying the specific quinine products (NDA/BLA/ANDA holders), then enumerating all listed Orange Book patents and their expiration dates.
What Paragraph IV challenges or ANDA filings affect quinine pricing?
In mature generic markets, Paragraph IV filings can matter if they trigger:
- court stays lifting,
- settlement terms that cap or delay generic entry,
- or launch-and-design-around outcomes that shift effective supply distribution.
A complete and accurate Paragraph IV litigation landscape for quinine cannot be produced here without product-specific ANDA/P-IV identification and docket verification.
How do biosimilars and biologics affect quinine (and why the market is different)?
Quinine is a small molecule. Biosimilar dynamics do not apply directly. Indirect effects occur only through:
- budget reallocation by purchasers when alternative malaria therapies are prioritized,
- guideline shifts that alter quinine procurement budgets.
How does quinine compare with artemisinin-based therapies on cost and procurement?
Cost comparisons depend on country and regimen selection:
- Artemisinin-based combination therapies (ACTs) generally dominate routine malaria treatment where programs are funded.
- Quinine remains relevant where ACT access is limited or where specific clinical pathways require it.
Procurement tends to favor standardized and tendered regimens. Quinine pricing volatility becomes more visible where it sits alongside:
- intermittent humanitarian procurement,
- emergency stock replenishment,
- and older formularies.
What price scenarios are most likely for quinine through 2030?
Scenario framework (base, upside, downside)
All projections should be treated as annualized ranges that incorporate supply stress. The market is too supply-inelastic for a single point estimate.
Base case (most likely absent a major disruption)
- 2025–2026: flat to modestly up (0% to 6% CAGR)
- 2027–2030: inflation-linked drift (3% to 5% CAGR)
Upside case (supply shock or compliance-driven shortage)
- 2025–2026: step-change pricing (10% to 30% in a year)
- 2027–2030: normalization after capacity returns (2% to 6% CAGR)
Downside case (inventory release, new supply reinstated, contracting competition)
- 2025–2026: near-flat (−2% to +2% in a year)
- 2027–2030: subdued growth (0% to 3% CAGR)
What changes the probabilities
- Any reduction in saleable injectable supply can lift unit pricing more than oral forms because the substitution options are narrower.
- Any sustained improvement in API availability tends to reduce price quickly in contract markets.
What commercial risks could derail price projections (shortages, recalls, FX, regulation)?
Shortages and supply reallocation
Pricing rises fastest when lead times expand and procurement allocation limits substitution.
Quality events and distribution pauses
Even brief regulatory actions can:
- reduce available lots,
- delay shipments,
- increase working capital needs for distributors,
- and reset quarterly contract terms upward.
FX and shipping
Quinine procurement and API sourcing frequently cross currency zones. FX volatility is a key driver for realized prices, especially in markets with constrained local manufacturing.
Guideline shifts
Reduced emphasis on quinine for leg cramps can limit non-malaria demand growth and cap pricing power.
Which end markets are most exposed to quinine price swings?
- Public sector malaria programs: exposed to procurement timing and emergency replenishment gaps.
- Hospital pharmacies: sensitive to injectable availability and lead times.
- Retail pharmacy: exposed to wholesaler stock shortages and substitute availability.
- Humanitarian tenders: price volatility can rise sharply when global supply is tight and award timelines are compressed.
What is the expected effect of manufacturing expansion or new suppliers?
New supplier entry in mature generics tends to reduce margins and stabilize prices, but the effect may lag due to:
- qualification timelines,
- regulatory release,
- and inventory turnover cycles.
When supply improves, pricing often drops quickly at the wholesale level, while retail and institutional contract pricing adjusts over 1–2 quarters.
Key takeaways: quinine price outlook and market strategy
- Quinine’s price path is driven more by global supply availability than by innovation or exclusivity economics.
- Base case is flat to modestly rising through 2026 and then inflation-linked increases through 2030.
- Upside risk is tied to manufacturing compliance events and injectable supply tightening.
- Downside risk comes from reinstated supply and contracting competition that reduces tender clearing prices.
- For modeling, track realized contract and import unit values with lead-time and shortage indicators, since list prices are not reliable for procurement outcomes.
FAQs
1) Why is quinine still procured when artemisinin therapies dominate malaria care?
Because some national systems rely on older protocols for severe malaria and because procurement access and stock continuity can keep quinine in treatment pathways.
2) Do quinine shortages affect oral and injectable products differently?
Yes. Injectable supply is typically more constrained by sterile manufacturing slots and regulatory release timing, causing sharper price moves when availability tightens.
3) What indicators best forecast quinine price changes?
Lead times, distributor allocation behavior, reported shortages, and import unit value trends from major exporting countries.
4) How do currency swings impact quinine pricing?
Because API and finished-goods supply chains often span currency zones, FX affects landed costs and contract renegotiations.
5) Can guideline changes on leg cramps materially change quinine demand?
They can limit long-term retail growth, but they rarely eliminate all use quickly; effects show up as slower volume rather than immediate demand collapse.
References (APA)
- FDA. (n.d.). Orange Book: Approved Drug Products with Therapeutic Equivalence Evaluations. U.S. Food and Drug Administration.
- WHO. (n.d.). WHO malaria treatment recommendations and guidance. World Health Organization.
- UN Comtrade. (n.d.). International trade statistics (unit values for quinine and related products). United Nations.
More… ↓
