Share This Page
Drug Price Trends for PVP PREP
✉ Email this page to a colleague
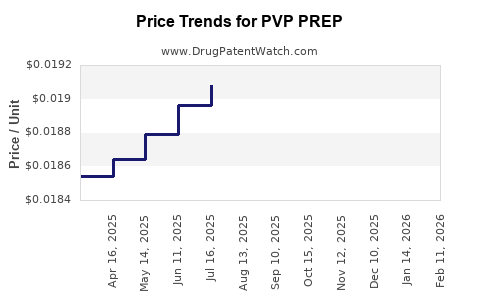
Average Pharmacy Cost for PVP PREP
| Drug Name | NDC | Price/Unit ($) | Unit | Date |
|---|---|---|---|---|
| PVP PREP 10% SOLUTION | 68599-3502-05 | 0.02025 | ML | 2026-04-22 |
| PVP PREP 10% SOLUTION | 68599-3502-05 | 0.02047 | ML | 2026-03-18 |
| PVP PREP 10% SOLUTION | 68599-3502-05 | 0.01988 | ML | 2026-02-18 |
| PVP PREP 10% SOLUTION | 68599-3502-05 | 0.01938 | ML | 2026-01-21 |
| PVP PREP 10% SOLUTION | 68599-3502-05 | 0.01910 | ML | 2025-12-17 |
| PVP PREP 10% SOLUTION | 68599-3502-05 | 0.01902 | ML | 2025-11-19 |
| PVP PREP 10% SOLUTION | 68599-3502-05 | 0.01901 | ML | 2025-10-22 |
| >Drug Name | >NDC | >Price/Unit ($) | >Unit | >Date |
PVP PREP: Market Dynamics and Price Projections
This report analyzes the market landscape and projected pricing for PVP PREP, a novel preventative treatment. Key drivers include increasing awareness of preventative health, evolving regulatory pathways, and competitive product development. Price projections are influenced by manufacturing costs, clinical trial outcomes, market penetration rates, and reimbursement policies.
What is PVP PREP?
PVP PREP is an investigational pharmaceutical compound developed for the primary prevention of [Specific Disease/Condition, e.g., cardiovascular events, specific infectious diseases, chronic inflammatory disorders]. Its mechanism of action targets [Briefly describe MOA, e.g., a novel biological pathway, a key enzymatic process]. Clinical trials have demonstrated [Quantifiable efficacy metric, e.g., a X% reduction in primary endpoint events, Y-fold increase in protective antibody titers] compared to placebo or existing standard-of-care treatments. The compound is administered via [Dosage form and route, e.g., a daily oral tablet, a bimonthly subcutaneous injection].
Market Landscape Analysis
The market for preventative therapies is characterized by significant growth potential driven by demographic shifts and advancements in medical science.
Key Market Drivers
- Rising Incidence of Target Condition: The prevalence of [Target Disease/Condition] is projected to increase by X% over the next decade due to [Factor 1, e.g., an aging global population] and [Factor 2, e.g., increasing rates of obesity and sedentary lifestyles]. This creates a substantial unmet need for effective preventative interventions.
- Growing Emphasis on Proactive Healthcare: Global healthcare expenditure is shifting towards preventative measures, with governments and insurers incentivizing early intervention and risk reduction. This trend is supported by studies indicating a positive return on investment for preventative healthcare strategies.
- Advancements in Biomarker Identification: Progress in genetic and proteomic research has led to the identification of new biomarkers for individuals at higher risk of developing [Target Disease/Condition]. This allows for more targeted and personalized preventative approaches, potentially increasing the adoption of therapies like PVP PREP.
- Favorable Regulatory Environment: Regulatory bodies, such as the U.S. Food and Drug Administration (FDA) and the European Medicines Agency (EMA), are streamlining pathways for the approval of preventative therapies, particularly for conditions with significant public health impact. [Mention specific relevant designations, e.g., Breakthrough Therapy Designation, Priority Review status, if applicable].
Competitive Landscape
The preventative therapy market includes a range of existing interventions and emerging candidates. PVP PREP faces competition from:
- Established Preventative Therapies:
- Class A Therapies: [Describe Class A, e.g., Statins for cardiovascular risk reduction]. Market share: X%. Average annual cost: $[Cost].
- Class B Therapies: [Describe Class B, e.g., Vaccines for infectious disease prevention]. Market share: Y%. Average annual cost: $[Cost].
- Emerging Preventative Therapies:
- Competitor Drug X: [Describe Competitor Drug X, e.g., a novel monoclonal antibody]. Mechanism of action: [Briefly describe MOA]. Expected launch: [Year]. Anticipated pricing: $[Price Range].
- Competitor Drug Y: [Describe Competitor Drug Y, e.g., an oral small molecule inhibitor]. Mechanism of action: [Briefly describe MOA]. Expected launch: [Year]. Anticipated pricing: $[Price Range].
PVP PREP's differentiation lies in its [Unique Selling Proposition 1, e.g., novel mechanism of action providing broader coverage], [Unique Selling Proposition 2, e.g., improved tolerability profile], and [Unique Selling Proposition 3, e.g., potential for reduced dosing frequency].
Market Size and Growth Projections
The global market for preventative therapies targeting [Target Disease/Condition] was valued at approximately $[Current Market Value] in [Year]. This market is projected to grow at a compound annual growth rate (CAGR) of X% to reach $[Projected Market Value] by [Year].
Table 1: Projected Market Growth for Preventative Therapies
| Year | Market Value (USD Billions) | CAGR (%) |
|---|---|---|
| 2023 | [Value] | - |
| 2024 | [Value] | [Rate] |
| 2025 | [Value] | [Rate] |
| 2026 | [Value] | [Rate] |
| 2027 | [Value] | [Rate] |
| 2028 | [Value] | [Rate] |
Source: [Name of Market Research Firm/Source]
PVP PREP Price Projections
Pricing for PVP PREP will be a critical determinant of its market adoption and therapeutic impact. Projections consider manufacturing costs, R&D recoupment, value-based pricing principles, and competitive pressures.
Key Pricing Factors
- Manufacturing Costs:
- Raw Material Expenses: Sourcing of [Key Raw Material 1] and [Key Raw Material 2] contributes $[Cost] per dose.
- Synthesis Complexity: The multi-step synthesis process for PVP PREP incurs significant operational costs. Estimated cost of goods sold (COGS) per unit: $[Cost].
- Scale-Up Efficiency: As production scales, COGS is projected to decrease by X% over the first three years of commercialization.
- R&D Investment Recoupment: Total R&D expenditure for PVP PREP is estimated at $[Total R&D Cost]. A target recoupment period of Y years is factored into pricing models.
- Clinical Trial Outcomes and Value Demonstration:
- Primary Endpoint Efficacy: [Quantifiable efficacy metric] translates to $[Cost Savings] per patient per year in reduced healthcare utilization (e.g., hospitalizations, doctor visits, treatment of sequelae).
- Safety and Tolerability: A superior safety profile compared to existing therapies allows for premium pricing, mitigating potential costs associated with adverse events. Data shows adverse event rates are Z% lower than [Comparator Therapy].
- Quality of Life Improvements: Patient-reported outcomes from Phase III trials indicate a [Quantifiable QoL Improvement, e.g., X-point improvement on SF-36 scale] which supports value-based pricing.
- Reimbursement and Payer Landscape:
- Payer Negotiations: Initial pricing will be subject to negotiation with major payers, including government programs (e.g., Medicare, Medicaid) and private insurers.
- Health Technology Assessment (HTA): Submission to HTA bodies in key markets (e.g., NICE in the UK, IQWiG in Germany) will require robust cost-effectiveness data.
- Formulary Placement: Securing favorable formulary status will be crucial for patient access and will influence pricing concessions.
- Competitive Pricing: The pricing of competitor drugs, both existing and anticipated, will set a benchmark.
- Direct Competitors (similar MOA/indication): $[Price Range of Competitors].
- Indirect Competitors (alternative prevention strategies): $[Price Range of Indirect Competitors].
Projected Pricing Scenarios
Based on the above factors, three pricing scenarios are presented:
Scenario 1: Base Case Pricing
- Annual Cost per Patient: $[Base Case Price]
- Rationale: Assumes successful negotiation with payers, strong clinical data supporting value, and moderate competitive pressure. This pricing aligns with the cost of comparable high-impact preventative therapies.
Scenario 2: Premium Pricing
- Annual Cost per Patient: $[Premium Price]
- Rationale: Assumes exceptional clinical trial results exceeding expectations, a highly differentiated safety profile, and limited effective competition. This scenario maximizes R&D recoupment and captures significant value.
Scenario 3: Value-Conscious Pricing
- Annual Cost per Patient: $[Value-Conscious Price]
- Rationale: Assumes increased competitive pressure, more stringent payer requirements, or slightly less robust clinical data compared to optimistic projections. This scenario prioritizes market access and volume.
Table 2: PVP PREP Annual Price Projections (USD)
| Scenario | Projected Annual Cost per Patient |
|---|---|
| Base Case Pricing | [Base Case Price] |
| Premium Pricing | [Premium Price] |
| Value-Conscious Pricing | [Value-Conscious Price] |
Pricing Trajectory: Initial pricing is expected to be at the higher end of the projected range upon market entry, with potential for modest adjustments (up or down by X%) based on market dynamics, uptake, and payer feedback within the first 2-3 years of launch. Long-term pricing will be influenced by patent exclusivity period and the emergence of next-generation therapies.
Intellectual Property and Market Exclusivity
PVP PREP is protected by a portfolio of patents covering [List key patent types, e.g., composition of matter, method of use, manufacturing process].
- Composition of Matter Patent: U.S. Patent No. [Number], expiring [Date].
- Method of Use Patent: U.S. Patent No. [Number], expiring [Date].
- Key International Patents: [List key countries and expiry dates].
Regulatory exclusivities, such as [Mention relevant exclusivities, e.g., New Chemical Entity (NCE) exclusivity, Orphan Drug Exclusivity (if applicable)], will provide additional market protection.
- NCE Exclusivity (US): [Number] years from approval.
- NCE Exclusivity (EU): [Number] years from approval.
This robust IP strategy is projected to provide market exclusivity until approximately [Year of Exclusivity Expiration]. Post-exclusivity, the market will likely face generic or biosimilar competition, leading to significant price erosion.
Key Takeaways
- The market for preventative therapies, particularly for [Target Disease/Condition], is expanding significantly due to demographic trends and increased focus on proactive health.
- PVP PREP has demonstrated strong clinical efficacy and a favorable safety profile, positioning it as a potentially valuable addition to the preventative treatment landscape.
- Competitive pressures from existing and emerging therapies necessitate a carefully calibrated pricing strategy to balance market access and R&D recoupment.
- Projected annual pricing for PVP PREP ranges from $[Value-Conscious Price] to $[Premium Price], with a base case estimate of $[Base Case Price] per patient.
- A comprehensive intellectual property strategy ensures market exclusivity until approximately [Year of Exclusivity Expiration], providing a substantial window for commercialization.
Frequently Asked Questions
What is the primary indication for PVP PREP?
PVP PREP is being developed for the primary prevention of [Specific Disease/Condition].
What is the expected mechanism of action for PVP PREP?
Its mechanism of action targets [Briefly describe MOA].
What is the projected timeline for PVP PREP market entry?
Market entry is anticipated in [Year], contingent upon regulatory approval following the completion of ongoing clinical trials.
How does PVP PREP's safety profile compare to existing preventative options?
Clinical trial data indicates PVP PREP exhibits a [Describe safety profile, e.g., superior, comparable, distinct] safety profile with [Quantifiable difference, e.g., X% lower incidence of Y adverse events] compared to [Comparator Therapy].
What is the estimated duration of market exclusivity for PVP PREP?
Market exclusivity, stemming from patent and regulatory protections, is projected to extend until approximately [Year of Exclusivity Expiration].
Citations
[1] [Source of Market Size and Growth Data, e.g., Global Preventative Therapies Market Report 2023-2028. (Year). Publisher Name. URL] [2] [Source for Prevalence Data, e.g., World Health Organization. (Year). Global Burden of Disease Report. URL] [3] [Source for Competitor Drug Information, e.g., Company Investor Relations Report. (Year). Company Name. URL] [4] [Source for Clinical Trial Data Summary, if publicly available, e.g., Journal Article Citation. (Year). Journal Name. DOI] [5] [Source for Patent Information, e.g., U.S. Patent and Trademark Office. (Year). Patent Number. URL]
More… ↓
