Last updated: February 15, 2026
What Is the Market Size and Growth Outlook for Potassium?
Potassium compounds, primarily potassium chloride, are critical in agriculture, pharmaceuticals, and industrial applications. The global market for potassium compounds was valued at approximately $20.5 billion in 2022. It is projected to grow at a compound annual growth rate (CAGR) of around 4.3% from 2023 to 2030, reaching roughly $30.9 billion by 2030. The growth drivers include increased demand for fertilizer, rising health awareness, and expanding industrial use.
Which Sectors Drive Demand for Potassium?
Agricultural Sector
Potassium fertilizers account for over 70% of global potassium consumption, mainly as potassium chloride (KCl). The balance comprises potassium sulfate and potassium nitrate. The shift toward precision agriculture and the need to increase crop yields sustains this sector's growth.
Chemical and Industrial Sector
Potassium compounds are used in manufacturing glass, detergents, and fire-softening agents. The expanding infrastructure in emerging economies amplifies these demands.
Pharmaceutical Sector
Potassium solutions and salts are essential in IV therapies, electrolyte replenishment, and certain medications, although this segment constitutes a smaller proportion of total demand.
Who Are the Leading Producers of Potassium?
The global potassium market has a few dominant players:
- Nutrien Ltd.: The largest producer with extensive KCl production capabilities.
- The Mosaic Company: Focuses on fertilizer-grade potassium products.
- OCP Group: Based in Morocco, controls significant Moroccan mines and production facilities.
- K+S Aktiengesellschaft: European-based with substantial European and North American operations.
- Yara International: Norwegian company with a focus on specialty fertilizers.
Production is concentrated in regions rich in potash ore, notably Canada, Russia, and Belarus, which collectively hold over 60% of the world's known reserves.
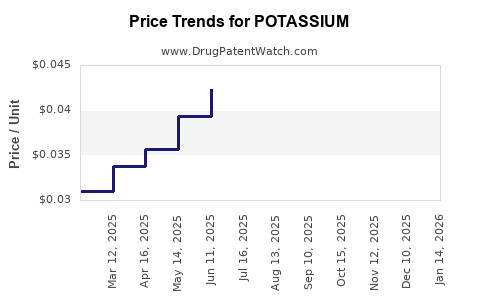
How Are Potassium Prices Trending?
Historical Price Overview
Potassium chloride prices have shown variability, influenced by supply chain disruptions, geopolitical factors, and seasonal demand. From 2020 to 2022, prices increased from approximately $200 per ton to over $400 per ton, peaking in early 2023, driven by sanctions on Russia and supply constraints.
Price Projections
Forecasts indicate a stabilization of prices around $350 to $400 per ton through 2025. Long-term, prices are expected to remain within $300-$400 range, with fluctuations driven by:
- New mine developments
- Mine closures or operational issues
- Changes in global fertilizer demand
- Trade policies and tariffs
Key Influences
- Supply disruptions: Political instability or mine strikes may cause near-term price spikes.
- Trade restrictions: Sanctions or tariffs can limit supply from key producers like Russia and Belarus.
- Environmental regulations: Stricter mining and environmental policies could slow new capacity additions.
What Are the Risks and Opportunities?
Risks
- Geopolitical tensions impacting exports from Russia and Belarus.
- Oversupply if new mines come online faster than demand increases.
- Environmental and regulatory restrictions limiting production expansion.
Opportunities
- Growing demand for specialty potassium compounds in niche markets.
- Innovations in fertilizer application boosting usage efficiency.
- Emerging economies' infrastructure development expanding industrial application markets.
Price Projection Summary Table
| Year |
Estimated Price Range (USD/ton) |
Key Factors |
| 2023 |
$350 - $400 |
Supply chain constraints, geopolitical tensions |
| 2025 |
$300 - $375 |
Market stabilization, new supply coming online |
| 2030 |
$300 - $400 |
Steady demand, supply adjustments |
Final Analysis
Potassium markets will experience stability with periodic volatility tied to geopolitical events and supply disruptions. Prices are expected to remain within a defined range through 2030, barring extraordinary circumstances. The primary growth driver remains fertilizer demand, primarily driven by global food security concerns.
Key Takeaways
- The global potassium market is valued at approximately $20.5 billion in 2022, with a forecast CAGR of 4.3% to 2030.
- Potassium chloride dominates as the primary fertilizer source, constituting over 70% of demand.
- Prices spiked in 2022-2023 due to geopolitical tensions involving Russia and Belarus.
- Price stability is expected around $300-$400 per ton through 2030.
- Supply risks include geopolitical tensions, environmental regulations, and mine capacity adjustments.
FAQs
1. What factors influence potassium price fluctuations?
Supply disruptions, geopolitical tensions, trade tariffs, environmental policies, and seasonal demand variations.
2. How reliant is the market on Russian and Belarusian potassium?
Russia and Belarus collectively account for roughly 40-50% of global potassium exports, making the market sensitive to their geopolitical status.
3. What are the primary applications of potassium beyond fertilizers?
Industrial uses in glass manufacturing, detergents, and fire-softening agents. Pharmaceuticals utilize potassium salts for electrolyte management.
4. Are there substitute materials for potassium fertilizers?
Limited substitutes exist; however, alternative nutrient formulations and farmers’ adoption of precision farming can optimize potassium use and reduce demand growth.
5. What is the outlook for potassium prices beyond 2030?
Prices are expected to stabilize within the $300-$400 range, provided supply and demand dynamics remain consistent, barring significant technological or geopolitical shifts.
References
- MarketWatch. "Potassium Fertilizer Market Size, Share & Trends Analysis." Published February 2023.
- S&P Global Platts. "Potassium chloride prices surge in early 2023." Published March 2023.
- US Geological Survey. "Mineral Commodity Summaries 2023."
- Nutrien Ltd. Annual Reports and Market Outlook Statements.
- Yara International. Sustainability and Market Reports 2022.