Last updated: February 20, 2026
What is the Current Market Size and Growth Trajectory?
The global pain management pharmaceuticals market was valued at approximately $47 billion in 2022. It is projected to reach $62 billion by 2028, with a compound annual growth rate (CAGR) of 4.7% (MarketsandMarkets, 2022). The increase reflects rising prevalence of chronic pain conditions, aging populations, and advancements in targeted pain therapies.
Segment Breakdown
- Acute pain medications: 40% of total market
- Chronic pain medications: 60% of total market
- Prescription opioids: 55%
- Non-opioid medications: 45%
Geographical Distribution
- North America: 45%
- Europe: 25%
- Asia-Pacific: 20%
- Rest of World: 10%
North America leads due to high prescription rates and regulatory approval for novel analgesics.
What Are the Leading Types of Pain Relief Drugs?
- Opioids (e.g., oxycodone, hydrocodone): 55% market share
- Non-steroidal anti-inflammatory drugs (NSAIDs): 20%
- Antidepressants (e.g., amitriptyline): 8%
- Anticonvulsants (e.g., pregabalin): 7%
- Novel therapies including biologics and small molecules: 10% (expected to grow)
Patents for generic opioids are expiring, opening opportunities for new formulations and delivery methods.
Who Are the Key Players?
Major pharmaceutical companies involved in pain relief research include:
- Pfizer
- AbbVie
- Eli Lilly
- Teva
- Johnson & Johnson
Innovative biotech startups are increasingly entering the space with biologic therapies targeting specific pain pathways.
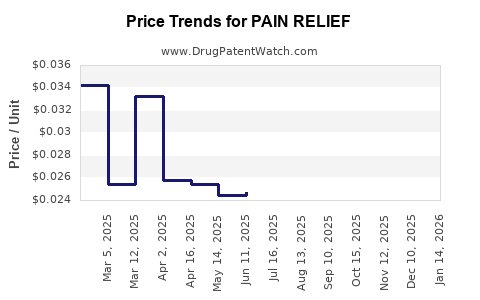
What Are Projected Price Trends for Pain Relief Drugs?
Average retail prices vary significantly:
- Traditional opioids: $1 - $3 per pill
- NSAIDs: $0.50 - $2 per tablet
- Biologic pain therapies: $5,000 - $15,000 annually per patient
Prices are influenced by drug patent life, development costs, regulatory approval timelines, and reimbursement policies. Patents hold for approximately 20 years, with part of that period allocated for commercialization and exclusivity.
Price Projection Over the Next 5 Years:
| Drug Type |
2022 Average Price |
2027 Estimated Price |
Price Change |
Drivers |
| Opioids |
$2 per pill |
$2.20 per pill |
+10% |
Limited patent expiration, regulated pricing |
| NSAIDs |
$1 per tablet |
$1.05 per tablet |
+5% |
Patient affordability concerns |
| Biologics |
$10,000 annually |
$12,000 annually |
+20% |
Innovation, complex manufacturing |
Biologic therapies are expected to account for 25% of the pain relief drug market by 2030, driven by pipeline advancements.
What Are the Regulatory and Reimbursement Influences?
Regulatory agencies (FDA, EMA) have tightened controls on opioids due to abuse concerns. Reimbursement policies favor non-opioid alternatives and innovative, cost-effective therapies. Payers increasingly require evidence of cost-effectiveness, influencing drug pricing strategies.
What is the Outlook for Market Entry and Innovation?
Emerging approaches include:
- Extended-release formulations reducing overdose risks
- Biologic therapies targeting specific pain pathways
- Gene therapies aiming for durable pain relief
- Digital health integration (e.g., pain monitoring apps with drug delivery systems)
Regulatory approval for new modalities remains challenging but offers premium pricing potential.
Key Takeaways
- The global pain management market is expanding at nearly 5% annually.
- Opioids dominate but face pricing pressures and regulatory scrutiny.
- Biologic and novel therapies are projected to increase their market share and pricing.
- Average drug prices for pain relief vary widely, influenced by drug type and patent status.
- Market entry is driven by unmet needs, technological innovations, and regulatory pathways favoring biologics.
FAQs
-
What factors influence the pricing of new pain relief drugs?
Patent exclusivity, development costs, regulatory approval timelines, and reimbursement policies primarily determine pricing.
-
Are non-opioid pain medications becoming more popular?
Yes, driven by the opioid crisis, payers favor non-opioid options, which are increasingly reimbursed with favorable policy adjustments.
-
What is the potential of biologics in pain management?
Biologics are expected to reach 25% of the market by 2030, with prices averaging $12,000 annually, reflecting their targeted efficacy and complex manufacturing.
-
How does patent expiration impact drug pricing?
Expiring patents lead to generic competition, generally reducing prices by 50-80%, incentivizing innovation for new proprietary therapies.
-
Which geographical markets present the greatest growth opportunities?
Asia-Pacific and Latin America offer growth potential due to expanding healthcare infrastructure and rising chronic pain prevalence.
References
[1] MarketsandMarkets. (2022). Pain Management Market by Drug Class and Region: Global Forecast to 2028.