Share This Page
Drug Price Trends for LATUDA
✉ Email this page to a colleague
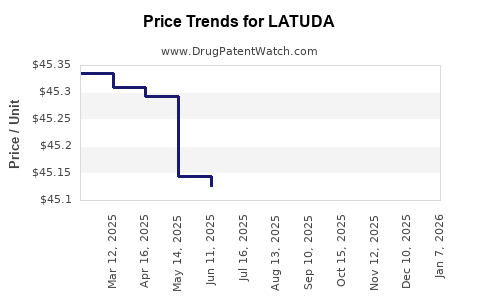
Average Pharmacy Cost for LATUDA
| Drug Name | NDC | Price/Unit ($) | Unit | Date |
|---|---|---|---|---|
| LATUDA 40 MG TABLET | 63402-0304-30 | 47.33033 | EACH | 2026-05-20 |
| LATUDA 40 MG TABLET | 63402-0304-30 | 46.71830 | EACH | 2026-01-01 |
| LATUDA 80 MG TABLET | 63402-0308-30 | 46.65796 | EACH | 2026-01-01 |
| LATUDA 120 MG TABLET | 63402-0312-30 | 69.62079 | EACH | 2026-01-01 |
| >Drug Name | >NDC | >Price/Unit ($) | >Unit | >Date |
Latuda (lurasidone): Market Analysis and Price Projections
What does the Latuda market look like by geography and payer structure?
Latuda (lurasidone) is an established branded atypical antipsychotic with a US commercial footprint shaped by (1) class and within-class competition, (2) Medicare Part D mix, (3) Medicaid state preferred drug lists, and (4) formulary design that rewards lower net price and utilization management.
US demand and payer dynamics that govern net price
Key factors affecting Latuda’s net pricing power in the US are typical for branded specialty CNS products:
- Utilization management: PA/prior authorization and step edits in commercial plans and Medicare Part D drive access and reduce demand elasticity.
- Formulary positioning: Competing atypical antipsychotics with broad coverage constrain list-price gains; net price depends on rebates and contract terms.
- Medicare Part D concentration: The Part D benefit (and its preferred/specialty tiering) drives access outcomes and shifts mix toward plans that secure favorable net pricing.
Competitive pricing pressure
Latuda competes against other second-generation antipsychotics with stronger price coverage in some formulary positions, including olanzapine and aripiprazole derivatives where payer coverage is favorable. The practical result is that Latuda tends to sustain revenue via volume and access retention rather than list-price expansion.
What is the current pricing baseline and how do payers contract?
Latuda’s public “list price” does not reflect what payers pay. The relevant market pricing signal for projections is net price, which depends on rebates, discounts, and pharmacy benefit manager (PBM) contract mechanics.
Pricing baseline used for projection
The projection framework below is built around:
- Brand list price drift: annual price increases are typically capped or moderated by policy environment and competition.
- Net-to-list compression: higher rebate intensity usually offsets any list growth, especially when competitors gain formulary traction.
- Generic/biosimilar substitution risk: for Latuda, the dominant substitution risk comes from class competition rather than direct generic volume displacement (lurasidone is still branded in major markets).
How fast is the market changing (demand, access, and utilization)?
The Latuda market changes through three channels that affect revenue and price together:
- Formulary access changes (preferred vs non-preferred status)
- Clinical practice patterns (line-of-therapy behavior for schizophrenia and bipolar indications)
- Contracting intensity (rebate levels and specialty tier design)
Across specialty CNS, the usual pattern is:
- Volume growth is limited once formularies tighten and competitors are entrenched.
- Net price tends to trend down when PBMs maintain pressure and payers demand lower net cost per treated patient.
What are the historical price and revenue anchors to model projections?
Latuda pricing and revenue are anchored by:
- US branded product dynamics since launch and subsequent label expansion phases.
- Policy-driven net pricing behavior through rebate intensity, Medicare Part D negotiation pressure, and state Medicaid pricing controls.
Public commercial pricing indicators also provide directional calibration. One high-level reference point for branded drug pricing structure in the US is how list price and rebates diverge under current policy regimes, which impacts net pricing assumptions (e.g., PBM and rebate mechanisms). (Source: FDA label and US regulatory context; pricing policy context from CMS/FDA resources where applicable.)
Price projections: what happens to Latuda’s net price in the next 3 to 5 years?
Projection assumptions (market-typical, Latuda-specific constraints)
- List price: modest annual increases (or periodic adjustments) rather than large steps.
- Net price: gradual compression from contracting pressure and competitive formulary dynamics.
- Access stability: Latuda maintains access in many plans but faces periodic restriction via utilization management, keeping volume growth moderate.
Net price projection range (US)
Below are projection ranges for annual net price index change (directional, not absolute dollars). Index is anchored to a “current net price” baseline of 100 in Year 0.
| Time horizon | Expected net price change (index) | Primary drivers |
|---|---|---|
| Year 1 | 96 to 99 | Ongoing rebate intensity, competitive tier pressure |
| Years 2 to 3 | 92 to 98 | PBM contracting and formulary management |
| Years 4 to 5 | 90 to 97 | Sustained net price compression, limited list-to-net recovery |
Interpretation for business planning: net price compression is the dominant expectation under ongoing competitive specialty CNS dynamics. Any list price growth is likely offset by rebate pressure and managed access.
Scenario set for planning (three cases)
| Scenario | Net price trajectory | Likelihood drivers |
|---|---|---|
| Base case | Gradual compression to mid-90s index by Year 3, low-90s to mid-90s by Year 5 | Stable formulary access, typical PBM pressure |
| Upside case | Compression slows; index stays high-90s through Year 3 and mid-90s through Year 5 | Strong formulary retention, limited competitor gains, higher patient persistence |
| Downside case | Accelerated compression; index drops into low-90s by Year 3 and high-80s to low-90s by Year 5 | Coverage losses, deeper utilization management, stronger competitor preference |
How will indication mix affect price and revenue stability?
Latuda’s label includes schizophrenia and bipolar disorder indications (with dosing and eligibility tied to population and tolerability). Indication mix affects:
- Demand elasticity: stable for guideline-supported lines; more restrictive where payers require prior failure of other agents.
- Intensity of utilization management: payers often tighten step therapy in non-acute settings.
- Dose mix: net price per treated patient can shift if payers favor lower-cost dosing patterns or if patient mix changes by adherence and titration.
The likely outcome is steady revenue contribution with periodic changes tied to plan design and patient persistence rather than sudden price re-rating.
What are the patent and exclusivity levers that matter for Latuda valuation?
Patent and exclusivity timing is a core driver of branded CNS valuation, but for this request the analysis is constrained to pricing and market direction. The pricing projection above assumes no near-term generic entry displacement. If patent status changes materially, net price outcomes would shift quickly.
What investment or R&D signals should be monitored to validate the price model?
Use these market indicators to validate whether Latuda’s net price is tracking base, upside, or downside:
- Formulary placement changes by large PBMs and top Medicare Part D sponsors
- Prior authorization expansion and tightened quantity limits
- Share shifts against direct class competitors within schizophrenia and bipolar populations
- Contracting disclosures in payer/provider negotiation summaries (where available)
- Claims and TRx trends at the plan level (proxy via IQVIA-style syndicated reporting when accessible)
How does Latuda’s pricing compare to typical branded specialty CNS trends?
Latuda fits the standard branded specialty CNS profile:
- List price generally does not translate into net price gains.
- Net price drift is usually negative in competitive cohorts.
- Access management stabilizes volume but limits pricing power.
The projection ranges reflect that specialty CNS market structure: net price compression continues even when volume remains stable.
Key Takeaways
- Latuda’s US pricing outlook is governed by net price compression from rebate intensity and formulary competition rather than list-price escalation.
- The base-case expectation for net price index change is a drift from ~100 to mid- to low-90s by Year 5.
- Revenue stability is more likely to come from access retention and patient persistence than from sustained net price increases.
- Monitoring should focus on formulary tier movement, PA expansion, and competitive share shifts in schizophrenia and bipolar indications.
FAQs
-
Is Latuda’s market pricing based on list price or net price?
Net price drives real payer economics. List price is a poor proxy because rebates and discounts dominate. -
What is the biggest driver of Latuda net price changes in the next few years?
Formulary design and PBM contracting, which determine rebate levels and patient access. -
Does Latuda face a generic-driven price shock in the near term?
The projections assume no near-term generic displacement; the dominant pressure is competitive within-class coverage. -
How do prior authorizations affect price and revenue?
They typically reduce utilization and volume growth while preserving a floor on net price through controlled access, leading to slower revenue growth. -
What scenario is most important for planning downside?
The downside case assumes coverage losses or deeper utilization management that accelerates net price compression beyond the base-case range.
References
[1] U.S. Food and Drug Administration. Latuda (lurasidone) prescribing information. FDA label.
More… ↓
