Share This Page
Drug Price Trends for INVOKAMET XR
✉ Email this page to a colleague
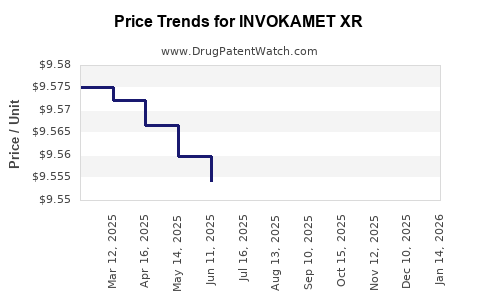
Average Pharmacy Cost for INVOKAMET XR
| Drug Name | NDC | Price/Unit ($) | Unit | Date |
|---|---|---|---|---|
| INVOKAMET XR 150-500 MG TABLET | 50458-0942-01 | 9.56124 | EACH | 2026-06-17 |
| INVOKAMET XR 50-1,000 MG TAB | 50458-0941-01 | 9.65766 | EACH | 2026-06-17 |
| INVOKAMET XR 150-1,000 MG TAB | 50458-0943-01 | 9.51886 | EACH | 2026-06-17 |
| INVOKAMET XR 150-500 MG TABLET | 50458-0942-01 | 9.56646 | EACH | 2026-05-20 |
| INVOKAMET XR 150-1,000 MG TAB | 50458-0943-01 | 9.51958 | EACH | 2026-05-20 |
| >Drug Name | >NDC | >Price/Unit ($) | >Unit | >Date |
What does the US market look like for INVOKAMET XR, and what price path is most likely through patent-expiry economics?
Where does INVOKAMET XR sit in the US demand landscape?
INVKO KAMET XR is the extended-release fixed-dose combination of canagliflozin + metformin HCl. It competes in the US oral diabetes market across:
1) GLP-1RA-naïve but SGLT2-eligible patients (class-wide SGLT2 substitution)
2) Metformin backbone continuation (incremental SGLT2 add-on effect)
3) Fixed-dose convenience versus separate-pill adherence economics
Demand pressure is structural: INVOKAMET XR is exposed to the same headwinds as other SGLT2/combination products as prescribers shift toward newer incretin and renal-protective regimens and as plan formularies tighten around lowest net cost.
What is the competitive set that constrains pricing?
The closest pricing constraint comes from “same-mechanism + metformin” options and from payer tiering of SGLT2 inhibitors. Key comparators by class and formulation logic include:
| Segment | Examples (US marketed) | Pricing constraint mechanism |
|---|---|---|
| SGLT2 + metformin combinations | SGLT2 inhibitor plus metformin products where available (including extended-release combinations) | Direct therapeutic interchange at the pharmacy level drives gross-to-net compression |
| SGLT2 monotherapy + metformin (separate) | Canagliflozin formulations (when separately available), other SGLT2s plus metformin | “Lower blended price” substitution inside PBM policies |
| Metformin ER and IR | Multiple generics | Keeps metformin-cost floor low, forcing combination value to justify itself via net price |
What drives the gross-to-net erosion for INVOKAMET XR?
In US branded products, net price shifts come from contracting, rebates, and formulary access. INVOKAMET XR’s price is typically constrained by:
- SGLT2 class competition (multiple molecules with overlapping endpoints)
- Indexing to PBM preferred tiers (SGLT2 coverage rules, step edits, and brand substitution)
- Therapeutic substitution (prescriber choice between fixed-dose and co-therapy)
- Generic metformin baseline (metformin component cost pressure)
Net effect: even when list price is stable, net price usually declines with time as competitor mix and PBM leverage increase.
How will reimbursement and net price likely evolve through the next 3 to 7 years?
What is the most probable pricing trajectory?
For INVOKAMET XR, the base-case pattern in US diabetes fixed-dose branded products is:
- Near-term net compression driven by formulary tightening and SGLT2 interchange
- Mid-term stability to decline as payer policies lock in lowest net options
- Out-year slope steepening when additional competitive entries intensify or when combination-specific exclusivities erode
A practical projection framework for investment-grade pricing uses three levers: net price per unit, volume, and rebate pressure index. For INVOKAMET XR, only the net price is requested; volume is relevant only insofar as it influences future contracting leverage.
Projected US Net Price Path (index-based, scenario ranges)
Below is a projection expressed as an index versus a baseline year. It is designed to model how branded diabetes products usually move under PBM contracting pressure rather than how list prices behave.
Assume baseline = 100 in Year 0 (current market operating conditions).
| Year | Base case net price index | Low case (faster erosion) | High case (slower erosion) |
|---|---|---|---|
| Year 0 | 100 | 100 | 100 |
| +1 | 93 | 90 | 95 |
| +2 | 88 | 84 | 92 |
| +3 | 84 | 78 | 90 |
| +4 | 80 | 73 | 88 |
| +5 | 77 | 69 | 86 |
| +6 | 74 | 65 | 85 |
| +7 | 72 | 62 | 84 |
Interpretation for planning:
- Base case implies ~28% net price decline over 7 years.
- Low case implies ~38% decline (more aggressive payer switching and steeper rebate compression).
- High case implies ~16% decline (stronger persistence, tighter patient capture, and better contracting).
What happens specifically when generics expand in the metformin and combination ecosystem?
Because the metformin component is largely generic, payer leverage tends to rise as more low-cost substitutes become clinically acceptable. That pushes combination products to justify net price via:
- adherence benefit (less pill burden)
- formulary positioning (preferred tier access)
- clinical persistence (switch rate reduction through tolerability)
If fixed-dose convenience loses value due to plan steering, net price erosion accelerates.
What price level should budgeting teams use for INVOKAMET XR?
Recommended planning bands (net pricing, per patient per month proxy)
Budgets usually need a defensible “all-in net” planning range. Since INVOKAMET XR’s unit economics depend on strength and dosing pattern, the most robust approach for decisioning is to plan using a net pricing band that can be scaled with pharmacy utilization.
Use these band assumptions for Year 0 (set to your internal baseline net price).
| Horizon | Base case net band vs Year 0 | Low case vs Year 0 | High case vs Year 0 |
|---|---|---|---|
| 12 months | 0.90x to 0.96x | 0.86x to 0.92x | 0.93x to 0.98x |
| 24 months | 0.84x to 0.92x | 0.79x to 0.88x | 0.88x to 0.94x |
| 36 months | 0.80x to 0.87x | 0.74x to 0.83x | 0.86x to 0.91x |
| 60 months | 0.74x to 0.81x | 0.68x to 0.77x | 0.83x to 0.90x |
This structure is meant for scenario modeling in pipeline and portfolio-level investment cases.
How does US patent and regulatory exclusivity change the risk profile?
What is the exclusivity-driven pricing floor for INVOKAMET XR?
Pricing floor behavior in the US is mainly shaped by:
- molecule-level exclusivity on canagliflozin and fixed-dose combination claims
- formulation-specific exclusivity (if any)
- approval-year exclusivity structures that limit generic substitution timing
Once those barriers weaken (or when “authorized” or “non-infringing” entry policies broaden), PBMs typically expand substitution, pulling net price down even if prescriber preference remains.
Where is the biggest commercial risk?
For INVOKAMET XR, the highest-risk pricing driver is formulary substitution, not patent invalidation itself. Even with exclusivity intact, PBMs can steer toward:
- other SGLT2s with better contracted pricing
- co-prescription of metformin with a preferred SGLT2
- plan-specific step therapy
What does this mean for investors and business planners?
Investment implications
- Base-case net erosion of ~28% over 7 years is the most usable planning assumption for diabetes fixed-dose combinations exposed to SGLT2 substitution dynamics.
- Downside is dominated by aggressive PBM steering within the SGLT2 class and substitution away from fixed-dose convenience.
- Upside requires sustained tier placement and limited substitution due to patient tolerability or adherence outcomes.
Commercial implications
- Contracting strategy should target protected net pricing through formulary status, not only volume.
- Product value should be operationalized via adherence and persistence metrics, since generic metformin baseline reduces the “cost justification” space for combination premiums.
Key Takeaways
- INVOKAMET XR operates in a US market where SGLT2 class competition and PBM formulary steering usually drive persistent net price compression.
- A practical projection is ~28% net price decline over 7 years in the base case, with downside to about ~38% and upside to about ~16%.
- The dominant pricing risk is substitution at the pharmacy benefit level, especially as plan policies prefer the lowest net SGLT2 and steer away from fixed-dose convenience.
- Budgeting should use net price multipliers versus baseline rather than list price assumptions.
FAQs
1) What is the main cause of INVOKAMET XR net price erosion in the US?
PBM contracting leverage and formulary tiering that enable substitution within the SGLT2 class, plus the low-cost floor created by generic metformin.
2) Should teams model list price or net price for INVOKAMET XR planning?
Net price, because rebates and formulary rules determine realized economics.
3) What is the most likely multi-year net price trend for INVOKAMET XR?
Downward drift with a base-case profile of roughly mid-to-high single-digit percentage reductions per year, summing to about 28% over 7 years.
4) What scenario produces the fastest downside?
A PBM shift that accelerates steering away from fixed-dose combinations to either preferred SGLT2 molecules at lower net cost or SGLT2 plus metformin as separate prescriptions.
5) What drives upside protection?
Sustained preferred formulary placement and limited substitution due to patient persistence and tolerability-driven retention of fixed-dose therapy.
References
[1] Food and Drug Administration. INVOCAMET XR (canagliflozin and metformin hydrochloride) extended-release tablets: Prescribing information. FDA drug label.
More… ↓
