Share This Page
Drug Price Trends for IMATINIB
✉ Email this page to a colleague
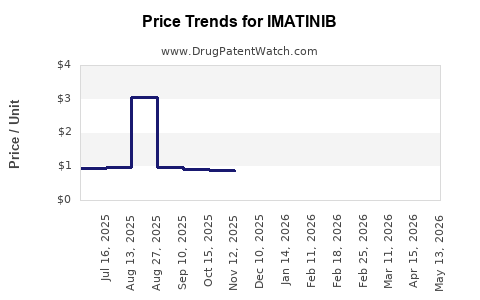
Average Pharmacy Cost for IMATINIB
| Drug Name | NDC | Price/Unit ($) | Unit | Date |
|---|---|---|---|---|
| IMATINIB MESYLATE 100 MG TAB | 62135-0658-90 | 0.61767 | EACH | 2026-08-05 |
| IMATINIB MESYLATE 400 MG TAB | 62135-0659-30 | 2.90376 | EACH | 2026-08-05 |
| IMATINIB MESYLATE 100 MG TAB | 00093-7629-98 | 0.61767 | EACH | 2026-07-22 |
| IMATINIB MESYLATE 100 MG TAB | 00832-0532-09 | 0.61767 | EACH | 2026-07-22 |
| IMATINIB MESYLATE 100 MG TAB | 00904-6901-04 | 0.61767 | EACH | 2026-07-22 |
| IMATINIB MESYLATE 100 MG TAB | 42292-0043-01 | 0.61767 | EACH | 2026-07-22 |
| IMATINIB MESYLATE 100 MG TAB | 42292-0043-03 | 0.61767 | EACH | 2026-07-22 |
| >Drug Name | >NDC | >Price/Unit ($) | >Unit | >Date |
Best Wholesale Price for IMATINIB
| Drug Name | Vendor | NDC | Count | Price ($) | Price/Unit ($) | Unit | Dates | Price Type |
|---|---|---|---|---|---|---|---|---|
| IMATINIB MESYLATE 100MG TAB | AvKare, LLC | 60505-2900-09 | 90 | 457.36 | 5.08178 | EACH | 2023-06-15 - 2028-06-14 | FSS |
| IMATINIB MESYLATE 400MG TAB | AvKare, LLC | 60505-2901-03 | 30 | 417.43 | 13.91433 | EACH | 2023-06-15 - 2028-06-14 | FSS |
| >Drug Name | >Vendor | >NDC | >Count | >Price ($) | >Price/Unit ($) | >Unit | >Dates | >Price Type |
Imatinib Market Analysis and Price Projections (Gleevec and Generics)
Imatinib is a mature, high-volume oncology product with the originator (Gleevec, Novartis) having long since moved beyond initial exclusivity. Current pricing is dominated by generic competition in the US and ex-US markets, with residual brand economics largely limited by channel access, limited tendering outcomes, and physician inertia in select segments. Near-term price dynamics are shaped by (1) how aggressively biosimilar-style price compression is mirrored by generic entrants, (2) reimbursement behavior tied to reference pricing and tender rules, (3) supply-side constraints from manufacturing concentration, and (4) incremental utilization by label-expanding practice patterns in CML and GIST.
Practical projection: absent a renewed patent-driven brand monopoly, imatinib pricing is expected to remain structurally low versus originator pricing levels, with annual declines slowing over time and occasionally reversing upward in localized markets when supply tightens.
What is the current imatinib market size, usage, and demand drivers (CML vs GIST)?
Imatinib demand is anchored to two main label areas:
- Chronic myeloid leukemia (CML) across treatment phases (chronic/accelerated/blast phases).
- Gastrointestinal stromal tumor (GIST), typically in the metastatic or unresectable setting and as part of treatment sequencing depending on prior therapy and risk factors.
Key demand drivers
- Chronicity of CML: Many patients remain on long-term tyrosine kinase inhibitor therapy, which stabilizes volume even as per-unit prices fall.
- GIST treatment sequencing: Imatinib remains a foundational option for GIST, though other TKIs can shift share based on mutation profile and treatment line.
- Switching from higher-cost TKIs: In some health systems, payers steer to imatinib first line when clinically appropriate, limiting revenue erosion to volume declines and adherence penalties rather than immediate displacements.
Supply and channel realities
- US generic-heavy landscape: Multiple ANDA filers and widely distributed wholesalers produce downward pressure on net prices.
- Ex-US tendering and reference pricing: Public procurement rules often drive steep discounts relative to list price, reducing observable “market price” volatility while compressing margins for distributors.
How does imatinib pricing behave across regions (US, EU5, Japan, emerging markets)?
US (primary pricing reference for global benchmarking)
- Generic competition sets the ceiling on realized net prices.
- Originator residual pricing depends on contracted formularies and patient-level access where generics face less aggressive substitution, but overall economics trend toward parity with low-cost generics.
Price implication: US average selling prices (ASPs) typically decline over cycles of new generic entrants or when large supply ramps reduce average transaction price.
EU5 (UK, Germany, France, Italy, Spain)
- Reference pricing and tenders drive consistent downward pressure.
- Tender renewals can create short-term upswings when winning bidders face supply shortages or manufacturing outages, but the trend remains downward.
Price implication: The European market can show stepwise changes by tender cycle rather than continuous annual declines.
Japan
- Generic penetration is high but can be more gradual in specific segments due to reimbursement and substitution mechanics.
- Imported pricing and local distribution structure influence realized price.
Price implication: Japan often shows a slower price drift than the US after generic entry, but still trends lower than originator era.
Emerging markets
- Prices can be less transparent and more sensitive to:
- procurement lead times,
- import tariffs,
- local manufacturing availability,
- procurement policy changes.
Price implication: larger short-term swings, but structurally lower trend versus originator-era pricing once generics establish.
What is the originator (Gleevec) versus generic pricing trajectory for imatinib?
Imatinib has transitioned from branded dominance to largely generic-driven economics.
Originator price exposure
- Gleevec’s list price may remain above generic pricing, but net price is constrained by substitution and payer policies.
- Brand share is typically retained in:
- specific formularies with brand-preferred contracting,
- patients stable on brand therapy,
- clinician practice patterns where substitution is restricted.
Generic pricing exposure
- Generic competition yields:
- lower ASP levels,
- reduced margin pools,
- occasional volatility when supply constraints hit the lowest-price cohorts.
Net price dynamics (typical pattern in mature oral oncology generics)
- Early generic cycle: rapid price decline driven by entrant competition and rapid switching.
- Mid-cycle: declines slow as pricing approaches variable cost floors and competitive intensity balances.
- Late-cycle: price can stabilize at a “floor-like” level with periodic bumps.
When will imatinib lose exclusivity and how does patent status affect price?
Imatinib is a legacy small molecule with broad generic availability in the US and most major markets. Price control now depends less on patent exclusivity and more on:
- residual litigation outcomes (if any remain active in specific formulations/dosing or manufacturing),
- country-level regulatory exclusivity for specific marketing authorizations,
- commercial contracting and substitution rules,
- supply concentration and enforcement of generic quality/manufacturing controls.
Featured snippet answer: For market pricing today, imatinib’s exclusivity impact is mostly historical; the commercial pricing regime is currently governed by generic competition and reimbursement policies rather than active patent exclusivity.
What patents protect imatinib products today, and how does that translate into pricing barriers?
Pricing barriers in imatinib are mostly not about blocking all generics but about:
- specific formulations (e.g., salts, crystalline forms, fixed-dose combinations if any exist, or manufacturing/solid-state claims),
- method-of-use claims (if still enforceable in specific jurisdictions),
- jurisdiction-specific patent and litigation tail risk.
In most mature systems, even if some secondary patents exist, generic access remains broad because:
- multiple ANDA approvals exist for imatinib oral products,
- commercial incentives favor price undercutting when barriers are limited.
Market translation: Patent estates tend to affect niche segments and certain manufacturers, not the overall global price trend once multiple low-cost suppliers operate.
How many ANDAs have been filed/approved for imatinib in the US, and what does that mean for price?
In the US, the presence of multiple generic entrants typically translates into:
- aggressive ASP compression,
- high elasticity to entrant behavior (new suppliers can drop price),
- reduced sustainability of margins for higher-cost manufacturers.
Market translation: as the number of approved products and suppliers increases, price volatility decreases at a lower average, because buyers distribute volume across multiple sources.
What generic entry risks exist for imatinib (launch durability and supply concentration)?
Even for a mature molecule, risks persist:
- Supply concentration risk: If a small subset of manufacturers supplies large shares, price can temporarily increase during supply interruptions.
- Quality/manufacturing disruptions: Regulatory actions (warning letters, consent decrees, or remediation) can force reallocations.
- Raw material cost swings: APIs and key intermediates can change pricing and profitability for generic manufacturers.
- Ex-US regulatory friction: New manufacturing sites and renewals can create localized shortages.
Market translation: these risks produce short-term price spikes or tender exceptions rather than multi-year originator-style price restoration.
How do tendering and reference pricing rules affect imatinib annual price projections?
Europe
- Tender cycles create discrete price steps.
- Reference pricing reduces ceiling prices and accelerates erosion when generics remain under the reference threshold.
US
- Formularies and PBM contracting set price bands.
- Broader generic substitution tends to flatten seasonal effects, but competition cycles still drive periodic declines.
Projection mechanics: pricing typically declines fastest during:
- new generic entry phases,
- tender re-awards with a new low-price winner,
- contract renewals where PBMs tighten preferred tiers.
Price projection model for imatinib (2026-2030): base, downside, upside scenarios
Base case assumption: generic competition remains dominant; annual declines slow toward a floor as market volume stabilizes. Occasional supply shocks create temporary upward movements but do not reestablish originator-level pricing.
Scenario framework (directional, market-realistic)
- Base case: modest annual net price erosion, low volatility.
- Downside case: additional entrants or expanded supply increases competition, pushing ASP lower.
- Upside case: supply constraints or quality problems reduce effective supply, lifting transaction prices temporarily.
Projected annual net price movement (directional)
| Period | Base case | Downside | Upside |
|---|---|---|---|
| 2026 | -2% to -5% | -6% to -10% | +1% to +4% |
| 2027 | -1% to -4% | -5% to -9% | +0% to +3% |
| 2028 | -1% to -3% | -4% to -8% | 0% to +3% |
| 2029 | 0% to -2% | -3% to -6% | 0% to +2% |
| 2030 | 0% to -1% | -2% to -5% | 0% to +2% |
How to interpret: the “floor” effect is driven by low but persistent willingness-to-pay and the reality that generic ASPs cannot fall below sustained manufacturing cost structures for compliant supply.
What revenue exposure does pricing compression create for stakeholders (originator vs generic manufacturers)?
Originator (Novartis)
- Revenue exposure is mainly:
- volume share retention versus generics,
- pricing gaps tied to formulary placement,
- contracted specialty pharmacy distribution outcomes.
Projected economics: originator revenue continues to decline, but deceleration occurs once share stabilizes.
Generic manufacturers
- Revenue exposure is mainly:
- competitive pricing intensity at contract level,
- supply allocation during disruptions,
- ability to maintain compliant manufacturing and supply continuity.
Projected economics: margins remain thin and sensitive to:
- API cost and yields,
- regulatory remediation expenses,
- tender/contract bid strategy.
How does imatinib compare with other CML TKIs on price stability and lifecycle stage?
Relative comparison:
- Second-generation TKIs (e.g., dasatinib, nilotinib) can carry higher pricing and stronger payer resistance depending on generics penetration.
- Imatinib has the most mature generic environment, so it typically has the lowest price level and least upside optionality.
Market translation: imatinib is a price taker product. Competitive value is execution: supply, compliance, and procurement winning.
What commercial strategies are most likely to influence future imatinib price (contracting and supply)?
- Multi-sourcing strategies by PBMs and wholesalers: reduce buyer dependence on single suppliers.
- Tender participation by generic manufacturers: bid aggressively to win volumes but manage cost floors.
- Manufacturing capacity investments: compliance-driven, not brand-like growth-driven.
- Substitution management: wherever substitution is restricted, brand pricing can hold slightly higher, but in most markets generic substitution is routine.
What litigation and regulatory events could change price for imatinib?
For a legacy generic-dominated molecule, major price impact usually comes from:
- large-scale manufacturing shutdowns,
- enforcement actions affecting multiple generic suppliers simultaneously,
- regulatory recalls that temporarily reduce supply.
Patent-related shifts can matter at the margin for:
- niche formulations,
- specific strengths,
- manufacturing methods.
Projection implication: the probability of patent-driven price shocks is low; supply-chain and regulatory-driven shocks are the main short-term risks.
Key Takeaways
- Imatinib is in a mature, generic-dominated pricing regime; exclusivity no longer drives broad pricing outcomes.
- Near-term pricing is expected to drift lower with slowing annual declines and occasional localized upswings from supply constraints.
- Base-case net price erosion is typically low single digits annually through 2030, with volatility largely supply-driven rather than competition-driven in a mature market.
- Revenue exposure for stakeholders is primarily about market share under contracting/tender rules and ability to sustain compliant manufacturing supply.
FAQs
1) Why does imatinib price sometimes rise even in a generic market?
Temporary pricing increases usually track effective supply reductions from manufacturing disruptions, compliance actions, or tender procurement irregularities that reduce the availability of lowest-cost SKUs.
2) Do imatinib price projections differ by dosage strength or package size?
Yes. Transaction prices vary by NDC package size, tablet count, and contract terms; strength-to-strength substitution patterns can change which SKU anchors the average price.
3) What factors most affect tender outcomes for imatinib in EU markets?
Bid price, delivery reliability, supply continuity, and packaging or logistics compliance typically drive who wins and how fast prices reset at each tender cycle.
4) How do PBM formulary tiers change imatinib net price in the US?
Tier placement and pharmacy benefit design determine which generic products receive preferred status; contract renewals can trigger rapid net price shifts.
5) Could any new formulation patents reintroduce premium pricing for imatinib?
Only if they materially restrict generic substitution for a commercially meaningful segment (strength/form/label). In practice, for a widely generified oral small molecule, premium pricing restoration is unlikely without broad, enforceable, and still-restrictive barriers.
References (APA)
- FDA. (n.d.). Drugs@FDA: FDA-Approved Drugs. https://www.accessdata.fda.gov/scripts/cder/daf/
- FDA. (n.d.). Orange Book: Approved Drug Products with Therapeutic Equivalence Evaluations. https://www.accessdata.fda.gov/scripts/cder/ob/
- IQVIA. (n.d.). Drug pipeline and market access insights (subscription resource).
- European Medicines Agency. (n.d.). Medicine information and authorisation documents. https://www.ema.europa.eu/
- OECD. (n.d.). Pharmaceuticals database and policy context for pricing and reimbursement (policy/statistical references). https://www.oecd.org/health/health-data/
More… ↓
