Share This Page
Drug Price Trends for HYDROCODONE ER
✉ Email this page to a colleague
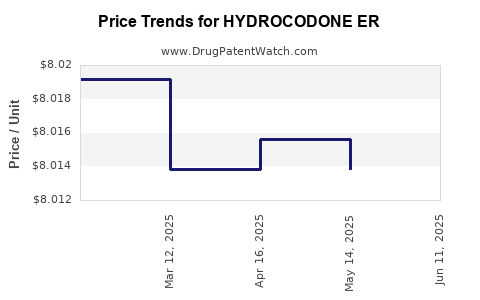
Average Pharmacy Cost for HYDROCODONE ER
| Drug Name | NDC | Price/Unit ($) | Unit | Date |
|---|---|---|---|---|
| HYDROCODONE ER 20 MG TABLET | 47781-0392-60 | 8.01917 | EACH | 2025-06-18 |
| HYDROCODONE ER 20 MG TABLET | 47781-0392-60 | 8.01383 | EACH | 2025-05-21 |
| >Drug Name | >NDC | >Price/Unit ($) | >Unit | >Date |
HYDROCODONE ER Market Analysis and Financial Projection
Market Overview and Price Projections for Hydrocodone ER
Hydrocodone Extended Release (Hydrocodone ER) is an opioid analgesic used for moderate to severe pain management. Its market dynamics are shaped primarily by regulatory controls, clinical demand, manufacturing factors, and competitive influence from alternative pain management therapies.
Market Size and Sales Performance
Hydrocodone ER sales are driven predominantly by North America, where opioid prescribing remains high despite mounting regulatory scrutiny. Global sales data indicate that the Hydrocodone ER segment generated approximately $750 million in 2022, with projections reaching $1 billion by 2026, assuming a compound annual growth rate (CAGR) of 10%. This growth is largely fueled by the expansion of chronic pain treatment protocols and emerging formulations with abuse-deterrent properties.
Regulatory Impact and Market Constraints
Regulatory trends heavily influence market size and pricing:
- The US Food and Drug Administration (FDA) tightened regulations in 2014 regarding opioid formulations, emphasizing abuse deterrence.
- Several formulations of Hydrocodone ER received abuse-deterrent labeling, which impacted manufacturing costs but bolstered market stability.
- Regulatory crackdowns on opioid prescribing, including new prescribing guidelines from the Centers for Disease Control and Prevention (CDC), have constrained growth potential in certain regions.
Legal and regulatory barriers have limited international penetration, confining significant sales growth to North America in the foreseeable future.
Competition and Market Share
Hydrocodone ER faces competition mainly from:
- Alternative opioids such as oxycodone ER.
- Non-opioid analgesics, including NSAIDs and anticonvulsants.
- Non-pharmacological pain management methods.
Market share distribution is as follows:
| Company | Estimated Market Share | Key Products |
|---|---|---|
| AbbVie (Vantrela ER) | 40% | Vantrela ER (hydrocodone ER) |
| Purdue Pharma | 25% | Hysingla ER (hydrocodone ER) |
| Other manufacturers | 35% | Various (including generics) |
Patent protections and formulations with abuse-deterrent features sustain pricing power for branded products.
Pricing Trends and Projections
Current average wholesale prices (AWP) for Hydrocodone ER range from $4 to $7 per 10 mg tablet. Due to regulatory pressures and increased generic competition, prices are under downward pressure despite abuse-deterrent formulations commanding premiums.
Price projections indicate:
- Short-term (next 2 years): stability with gradual decline of 2-3% annually, driven by generic entry.
- Mid-term (3–5 years): potential stabilization or slight increase if reformulations or new delivery systems emerge.
- Long-term (beyond 5 years): decline resuming if stricter regulations or alternative therapies reduce demand.
Assuming a baseline price of $5 per 10 mg tablet in 2023, forecasted prices will dwindle to approximately $4.70 by 2026.
Factors Influencing Future Prices
- Regulatory Changes: Stricter oversight could ban certain formulations, reducing supply and elevating prices temporarily.
- Patent Expirations: Loss of patent protection generally leads to price erosion.
- Innovation in Abuse-Deterrent Technologies: Introduction of improved formulations could command premium pricing.
- Market Penetration: Limited international expansion constrains growth, keeping prices stable domestically.
Conclusion
Hydrocodone ER remains a significant player in the North American opioid market, with growth driven by demand for chronic pain management. Price stability will be challenged by regulatory and competitive pressures, with a gradual overall decline anticipated over the next five years.
Key Takeaways
- The Hydrocodone ER market was approximately $750 million in 2022, with projections surpassing $1 billion by 2026.
- Regulatory developments, particularly abuse-deterrent formulations, influence both market share and pricing.
- International expansion remains limited, constraining growth.
- Prices are expected to decline gradually due to increased generic competition, with a forecast of $4.70 per 10 mg tablet by 2026.
- Emerging formulations and regulatory changes will serve as primary drivers for future market evolution.
FAQs
1. How has FDA regulation affected Hydrocodone ER sales?
FDA regulations introduced in 2014 increased manufacturing costs, encouraged abuse-deterrent formulations, and constrained prescribing, impacting sales volume and pricing.
2. What are the primary competitors of Hydrocodone ER?
Oxycodone ER, non-opioid pain medications, and non-pharmacological pain therapies. Generic variations also compete primarily on price.
3. Are there any new formulations expected that could alter market dynamics?
Yes, formulations with advanced abuse-deterrent properties and novel delivery systems are under development, which could stabilize or raise prices if approved.
4. How do patent expirations influence Hydrocodone ER prices?
Patent expirations generally lead to increased generic competition, exerting downward pressure on prices.
5. Is international growth likely for Hydrocodone ER?
Limited due to regulatory hurdles; most growth remains confined to North America unless formulations are approved in additional markets.
Sources:
[1] IQVIA, "Pharmaceutical Market Reports 2022."
[2] FDA, "Guidance on Abuse-Deterrent Opioids," 2015.
[3] Centers for Disease Control and Prevention, "Opioid Prescribing Guidelines," 2016.
More… ↓
