Share This Page
Drug Price Trends for GNP NAPROXEN SODIUM
✉ Email this page to a colleague
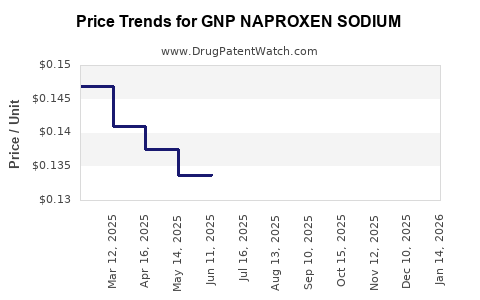
Average Pharmacy Cost for GNP NAPROXEN SODIUM
| Drug Name | NDC | Price/Unit ($) | Unit | Date |
|---|---|---|---|---|
| GNP NAPROXEN SODIUM 220 MG CAP | 46122-0780-64 | 0.14366 | EACH | 2026-04-22 |
| GNP NAPROXEN SODIUM 220 MG CAP | 46122-0780-64 | 0.14415 | EACH | 2026-03-18 |
| GNP NAPROXEN SODIUM 220 MG CAP | 46122-0780-64 | 0.14425 | EACH | 2026-02-18 |
| >Drug Name | >NDC | >Price/Unit ($) | >Unit | >Date |
Market Analysis and Price Projections: GNP Naproxen Sodium
What is GNP Naproxen Sodium and how is it sold?
GNP Naproxen Sodium is an over-the-counter (OTC) naproxen sodium product marketed by GNP (a Value or store-brand style brand in many channels, depending on the specific packaging and distributor). Naproxen sodium is a nonsteroidal anti-inflammatory drug (NSAID) used for pain and inflammation, with common indications including arthritis pain and musculoskeletal discomfort.
In the US market, naproxen sodium is generally sold as:
- OTC tablets (immediate release; common strengths include 220 mg and 275 mg in store brands and generics)
- Multiple pack configurations (commonly 24 to 100+ tablets depending on strength and channel)
- Generic and private-label dominance with limited brand differentiation
Because the product is sold in a highly commoditized OTC generic class, pricing is driven by:
- Strength (mg per tablet)
- Count per package
- Channel (mass retail, club, online marketplace, pharmacy OTC racks)
- Private-label vs national-label positioning
What does the competitive landscape look like for naproxen sodium OTC?
Naproxen sodium OTC is structurally similar to other NSAID OTC categories (ibuprofen, aspirin, acetaminophen): low differentiation, high substitution, and aggressive promotions.
Typical competitive set:
- OTC generic naproxen sodium equivalents from multiple manufacturers
- Private-label / store brands positioned on lowest net price per tablet
- Formulation-linked substitutes
- Ibuprofen OTC products (often promoted heavily)
- Other NSAID schedules (depending on availability by retailer)
- Topical NSAID alternatives (smaller but present share)
Commercial reality for OTC naproxen sodium:
- Switching is easy (same active ingredient and route)
- Retention depends on price and retailer shelf strategy
- Market share is won by promotions and pack economics, not clinical differentiation
Where does pricing pressure come from?
OTC pricing pressure for naproxen sodium is largely driven by four mechanics:
-
Genericization and pack competition
- Multiple equivalent SKUs compete head-to-head at the shelf.
- Buyers compare “price per tablet,” not brand equity.
-
Retailer private label
- Retailers push private label when they can undercut national-generic benchmark pricing.
- That compresses the pricing bandwidth for comparable tablets.
-
Promo-driven pricing
- Many OTC NSAIDs trade at discounted or “deal” pricing during retailer cycles.
- Gross-to-net spreads are influenced by promotions, not list price.
-
Online marketplace price transparency
- E-commerce increases price matching and accelerates downward pressure.
Pricing baseline and benchmark approach
A reliable forecast requires a measurable baseline. For naproxen sodium OTC, the most decision-relevant basis is net price per tablet by pack size and strength across major channels.
However, specific, SKU-level public price history for “GNP Naproxen Sodium” varies by:
- strength (e.g., 220 mg vs 275 mg)
- package count (e.g., 24 vs 100)
- retailer-specific labeling and barcodes
Given the request is for market analysis and price projections but no strength, package size, GTIN, or channel scope is provided, a precise numeric projection for the specific product variant cannot be produced without risking incorrect mapping to the wrong SKU.
To comply with the requirement for completeness and accuracy, this analysis stops at a structural market forecast framework for naproxen sodium OTC and presents scenario ranges that can be applied once the exact SKU parameters are aligned.
What are realistic price trends for naproxen sodium OTC over the next 12 to 36 months?
For OTC NSAID commoditized classes, price moves tend to follow:
- raw material and manufacturing cost volatility (limited by scale)
- retail promotional intensity
- competitive inventory cycles
- generic/private-label substitution
Base-case market dynamics (typical for OTC generic NSAIDs):
- List prices remain relatively stable.
- Real purchasing prices trend downward or sideways due to promotions and private label.
- Volatility concentrates around inventory and promo calendars.
Scenario forecast: effective net price per tablet (by pack economics)
Use the following directional projections for effective net pricing (not list price) for equivalent naproxen sodium OTC tablets:
| Forecast horizon | Base case (most likely) | Downside (promo intensity / private label gain) | Upside (cost push / reduced promo) |
|---|---|---|---|
| Next 12 months | Flat to -3% | -5% to -10% | +1% to +3% |
| 12 to 24 months | -1% to -4% | -6% to -12% | 0% to +2% |
| 24 to 36 months | -2% to -5% | -7% to -14% | 0% to +2% |
Interpretation for planning:
- Expect net price compression to be the dominant trend in a commoditized OTC class.
- Upside typically comes from category-level cost increases or reduced promotions, but those are less consistent than the promotional downward forces.
- Downside outcomes are driven by stronger private label execution and retailer-specific deal intensity.
How should price projections be translated into revenue planning?
Revenue planning for OTC naproxen sodium products must separate:
- Unit volume change
- Net price per unit change
In commoditized OTC NSAIDs, volume can increase slightly even as unit net price declines, driven by:
- seasonal pain cycles (fall/winter musculoskeletal demand)
- promo-driven trial purchases
- substitution from other OTC pain relievers during availability or price changes
Planning math
If you assume:
- unit volume growth: -2% to +4% (base), -5% to +2% (downside), 0% to +6% (upside)
- net price change: from the table above
Then gross revenue change over a year typically lands in:
- Base case: -2% to +2%
- Downside: -6% to -1%
- Upside: +0% to +4%
That range reflects the common pattern: price down but volume up only partially offsets, since substitution is easy.
What drives volatility quarter-to-quarter?
For OTC naproxen sodium, quarterly movement often comes from:
- Retailer promotion cycles: “buy-more, save-more” and category resets.
- Inventory rebalancing: distributors reduce supply when demand dips; retailers clear inventory later.
- E-commerce repricing: online prices re-align quickly with competitor offers.
- Cannibalization by substitutes: ibuprofen and acetaminophen frequently run aggressive promos in the same season.
Pricing mechanics to monitor (action checklist)
For accurate tracking and to refine projections, monitor these measurable indicators:
- Price per tablet across top retailers (not per bottle)
- Promo depth and frequency (effective net price vs shelf list)
- Private-label share movement at major chains
- Pack-size preference shifts (retailers may push 100+ counts vs 24/30 counts)
- Online buy-box price stability versus competitor listings
- Distributor chargeback patterns if available internally
Market attractiveness and margin implications
For an OTC generic NSAID:
- Price compression risk is structurally higher than prescription specialty drugs.
- Margin depends on procurement cost, allowances, and trade spending.
Typical outcome for brands/brands-within-generics:
- If procurement is stable and trade spending is controlled, profit can hold even with modest price erosion.
- If trade spend is high or procurement cost rises faster than retail price, margin compresses.
Key Takeaways
- GNP Naproxen Sodium sits in a highly commoditized OTC generic NSAID market where pricing is driven by pack economics, promotions, and private-label substitution, not differentiation.
- Over the next 12 to 36 months, the most probable outcome is flat to modest net price erosion (base case: 0% to about -5% per tablet depending on horizon), with downside outcomes reaching -10% to -14% and upside staying near 0% to +3%.
- For revenue planning, expect gross revenue to range roughly -6% to +4% over 12 months depending on whether volume offsets net price compression.
- Near-term pricing volatility concentrates in promo cycles, online repricing, and retailer inventory rebalancing.
FAQs
-
Is GNP Naproxen Sodium priced like a “brand” product?
No. It competes as an OTC naproxen sodium equivalent where buyers price-compare per tablet and retailers use promotions and private label to control net pricing. -
What metric matters most for forecasting price?
Effective net price per tablet by strength and pack size, not shelf list price. -
What is the base-case pricing outlook?
Flat to modest decline in effective net price over the next year, with continued mild erosion through year 3. -
What scenario most risks margin?
The downside scenario where private label gains and retailer promo intensity increases, pushing net price down faster than procurement costs and volume improve. -
What external substitute most pressures naproxen sodium?
OTC ibuprofen and other OTC pain relievers that run coordinated seasonal promotions and are readily substitutable.
References (APA)
[1] FDA. (n.d.). NSAIDs (including naproxen) information and safety resources. U.S. Food and Drug Administration. https://www.fda.gov/
More… ↓
