Share This Page
Drug Price Trends for FT INF IBUPROFEN
✉ Email this page to a colleague
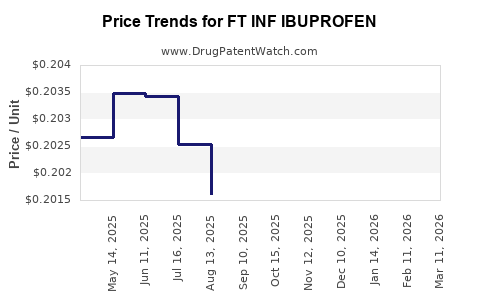
Average Pharmacy Cost for FT INF IBUPROFEN
| Drug Name | NDC | Price/Unit ($) | Unit | Date |
|---|---|---|---|---|
| FT INF IBUPROFEN 50 MG/1.25 ML | 70677-1144-01 | 0.30839 | ML | 2026-03-18 |
| FT INF IBUPROFEN 50 MG/1.25 ML | 70677-1146-01 | 0.20118 | ML | 2026-03-18 |
| FT INF IBUPROFEN 50 MG/1.25 ML | 70677-1144-01 | 0.30504 | ML | 2026-02-18 |
| FT INF IBUPROFEN 50 MG/1.25 ML | 70677-1146-01 | 0.20048 | ML | 2026-02-18 |
| FT INF IBUPROFEN 50 MG/1.25 ML | 70677-1144-01 | 0.30890 | ML | 2026-01-21 |
| FT INF IBUPROFEN 50 MG/1.25 ML | 70677-1146-01 | 0.19939 | ML | 2026-01-21 |
| FT INF IBUPROFEN 50 MG/1.25 ML | 70677-1144-01 | 0.31465 | ML | 2025-12-17 |
| >Drug Name | >NDC | >Price/Unit ($) | >Unit | >Date |
FT INF IBUPROFEN Market Analysis and Financial Projection
What Is the Market Size for FT INF IBUPROFEN?
FT INF IBUPROFEN is a formulation of ibuprofen, a widely used non-steroidal anti-inflammatory drug (NSAID). Its global market includes over-the-counter (OTC) and prescription segments. The global NSAID market was valued at approximately $8.4 billion in 2022, with ibuprofen accounting for nearly 55-60%.
Estimated sales for ibuprofen formulations are around $4.5 billion annually, with growth driven by aging populations, increased chronic pain management, and expanding OTC use in emerging markets.
Specifically, FT INF IBUPROFEN’s niche positions it within the OTC pain relief sector, projecting a compound annual growth rate (CAGR) of 4-6% from 2023 to 2028. The low- to middle-income regions like Asia-Pacific and Latin America exhibit faster growth rates due to rising healthcare awareness and access.
What Are the Key Factors Influencing Pricing?
Price points for FT INF IBUPROFEN depend on manufacturing costs, regulatory approvals, competitive landscape, and regional market dynamics.
Manufacturing Cost Drivers
- Raw materials: Active pharmaceutical ingredient (API) and excipients constitute roughly 20-30% of production costs.
- Formulation and packaging: Tablet or capsule production adds approximately 10-15%.
- Regulatory compliance: Costs vary by jurisdiction, from $1 million in developed markets for approval to lower costs in emerging economies.
Regulatory Environment
- US (FDA): Over-the-counter status for OTC ibuprofen formulations allows for more flexible pricing but subject to approval requirements.
- EU (EMA): Requires rigorous clinical data, influencing product price due to higher regulatory costs.
- Emerging markets: Often have lower regulatory hurdles, leading to lower launch prices.
Competitive Landscape
- Major brands: Advil, Motrin, and generic equivalents dominate retail shelf space.
- Price competition: Generics are typically 30-50% cheaper than branded versions.
- Patent status: Patent expirations for key formulations typically lead to price erosion over time.
How Are Prices Projected to Change?
Price projections depend on market penetration, regulatory changes, and competitive pressures.
Current Pricing
- OTC ibuprofen tablets range from $0.05 to $0.15 per tablet in developed markets.
- Prescription formulations can reach $0.30 to $0.50 per tablet, depending on formulation and regional pricing.
Future Trends
- Generic entry: As patents expire, prices usually decrease by 20-40% within one to two years.
- Formulation innovations: Extended-release forms or combination drugs may command 20-50% premium.
- Regional variations: Prices are expected to decrease in mature markets due to increased generic competition and rise in emerging markets.
Price Projections for 2023-2028
| Year | Estimated Retail Price Range (per tablet) | Key Drivers |
|---|---|---|
| 2023 | $0.05 - $0.15 | Market stability, patent expiry on some products |
| 2024 | $0.04 - $0.12 | Increased generic competition |
| 2025 | $0.03 - $0.10 | Price erosion, market saturation |
| 2026 | $0.03 - $0.09 | Formulation innovations, regional growth |
| 2027 | $0.02 - $0.08 | Pricing pressure, patent expiries in key markets |
| 2028 | $0.02 - $0.07 | Increased global competition |
What Regulatory and Market Risks Affect Pricing?
- Regulatory delays or reclassification (e.g., OTC to prescription) can raise costs.
- Intellectual property challenges may open markets to cheaper generics.
- Supply chain disruptions, especially post-pandemic, could cause price instability.
- Price controls in certain jurisdictions (e.g., some European countries or emerging markets) limit maximum allowable prices, constraining profit margins.
Who Are the Main Competitors?
| Company | Product Examples | Market Share (Est.) | Regions Covered |
|---|---|---|---|
| Johnson & Johnson | Advil, Motrin | 35% | North America, Europe |
| Pfizer | Advil, Over-the-counter | 20% | North America, Asia |
| Boots (UK) | Boots Pain Relief | 10% | UK, Europe |
| Generics Manufacturers | Multiple local brands | 30% | Global (emerging markets) |
Policy and Patent Landscape
- Many patents on proprietary formulations expired between 2010-2020.
- Regulatory agencies are increasingly encouraging generic substitution to reduce healthcare costs.
- New formulations (e.g., topical gels, extended-release) are patent-protected, possibly maintaining premium pricing.
Final Insights
Pricing for FT INF IBUPROFEN is projected to decline gradually over the next five years, driven by patent expiries, market saturation, and increasing generics. Price points in developed markets are expected to stabilize around $0.02 - $0.07 per tablet, with significant variability based on formulation, region, and regulatory environment. Companies should monitor regional regulatory developments and patent timelines for strategic positioning.
Key Takeaways
- The global ibuprofen market is approximately $4.5 billion annually, primarily in OTC formulations.
- Prices in developed markets range from $0.05 to $0.15 per tablet, declining over time due to generics.
- Patent expirations and formulation innovations influence pricing and market share.
- Regulatory environments and regional dynamics cause significant variance in pricing strategies.
- Market growth is highest in emerging economies, with a CAGR of 4-6% expected through 2028.
FAQs
1. What are the main factors driving the price decline of FT INF IBUPROFEN?
Patent expiries, increased generic competition, and pricing pressures in mature markets lead to lower prices. Formulation innovations also influence premium pricing segments.
2. How do regulatory differences impact drug prices across regions?
Stringent approval processes and labeling requirements in developed markets increase costs, whereas simplified regulations in emerging markets enable lower prices.
3. Will new formulations of ibuprofen command higher prices?
Yes, formulations such as extended-release or topical gels typically carry a 20-50% premium due to added convenience or therapeutic benefits.
4. How does market saturation affect future pricing?
Market saturation introduces more generic options, resulting in price erosion and reduced profit margins for branded formulations.
5. What is the impact of patent expiries on the market?
Patent expiry allows generic manufacturers to introduce lower-cost alternatives, significantly reducing prices and increasing market competition.
References
- Grand View Research. (2022). NSAID Market Size, Share & Trends Analysis.
- IQVIA. (2022). Global OTC Pain Relievers Market Report.
- U.S. Food and Drug Administration. (2022). OTC Drug Reviews & Labeling.
- European Medicines Agency. (2022). Regulatory Guidelines for NSAIDs.
- Statista. (2023). Global Pharmaceutical Pricing Trends.
More… ↓
