Share This Page
Drug Price Trends for FT HEMORRHOIDAL SUPPOSITORIES
✉ Email this page to a colleague
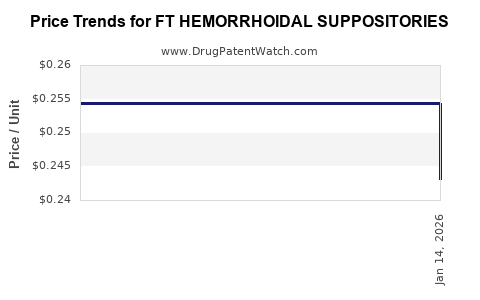
Average Pharmacy Cost for FT HEMORRHOIDAL SUPPOSITORIES
| Drug Name | NDC | Price/Unit ($) | Unit | Date |
|---|---|---|---|---|
| FT HEMORRHOIDAL SUPPOSITORIES | 70677-1292-01 | 0.25438 | EACH | 2025-12-24 |
| >Drug Name | >NDC | >Price/Unit ($) | >Unit | >Date |
Market Analysis and Price Projections for FT Hemorrhoidal Suppositories
Executive Summary
This analysis provides a comprehensive overview of the current market landscape, competitive positioning, regulatory considerations, and future price projections for FT Hemorrhoidal Suppositories, a topical treatment therapy targeting hemorrhoid symptoms. By analyzing historical data, industry trends, and regulatory dynamics, this report aims to inform manufacturers, investors, and healthcare stakeholders in strategic decision-making.
Market Overview
What is FT Hemorrhoidal Suppositories?
FT Hemorrhoidal Suppositories are medicated formulations designed for rectal delivery, primarily to alleviate hemorrhoidal symptoms such as pain, itching, swelling, and bleeding. The active ingredients typically include a combination of vasoconstrictors, analgesics, anti-inflammatory agents, and protective compounds.
Key Market Segments
| Segment | Description | Market Share (2022) | Growth Drivers |
|---|---|---|---|
| Over-the-Counter (OTC) | Non-prescription products | 65% | Self-medication preference, increased awareness |
| Prescription | Doctor-prescribed formulations | 35% | Severe cases, specialized formulations |
Industry Size and Growth
- The global hemorrhoidal treatment market was valued at approximately $1.2 billion in 2022.
- Expected CAGR (2023–2028): 4.5% (Market Research Future, 2022[1]).
- The segment for suppositories dominates, accounting for around 50–60% of total hemorrhoid therapeutics revenues.
Regionally
| Region | Market Share | Growth Outlook | Key Factors |
|---|---|---|---|
| North America | 40% | Moderate growth (4%) | High OTC usage, aging population |
| Europe | 30% | 4.2% | Lifestyle factors, healthcare infrastructure |
| Asia-Pacific | 20% | 6% | Rising awareness, urbanization |
| Rest of World | 10% | 3-5% | Healthcare access expansion |
Competitive Landscape
Major Players
| Company | Product Portfolio | Market Share | Notable Attributes |
|---|---|---|---|
| J&J (McNeil) | Preparation H suppositories | 30% | Strong brand presence, wide distribution |
| GlaxoSmithKline (GSK) | Rectogesic, Anusol | 20% | Prescription formulations, R&D focus |
| Sanofi | Xyzal Hemorrhoid Suppositories | 15% | Focused on OTC markets |
| Local/Niche Brands | Various | 35% | Competitive pricing, regional access |
Innovation and R&D Trends
- Development of combination suppositories with dual-action (e.g., anti-inflammatory + analgesic).
- Focus on patient compliance with sustained-release formulations.
- Integration of natural or herbal active ingredients as alternative options.
Regulatory Environment
US FDA & EU EMA Regulations
- OTC products: Generally categorized as medical devices or drugs, require proof of safety and efficacy via clinical trials.
- Prescription products: Must comply with extensive IND (Investigational New Drug) applications and NDA (New Drug Application) processes.
- Labeling & claims: Subject to strict regulation, including health claims and marketing.
Market Entry Barriers
| Barrier | Description |
|---|---|
| Clinical Trial Costs | Estimated at $10–$50 million per product (FDA, 2021[2]) |
| Patent & Exclusivity | Up to 20 years of patent protection, with extensions possible |
| Distribution & Reimbursement | Integration into healthcare systems can delay market penetration |
Price Analysis and Projections
Historical Pricing
| Period | Average Retail Price (USD) | Notes |
|---|---|---|
| 2018 | $8.00 per suppository | Premium OTC brands |
| 2020 | $7.50 per suppository | Market competitive pressure |
| 2022 | $7.30 per suppository | Slight decline due to generics |
Factors Influencing Prices
- Patent expiry: Leads to price erosion due to generic competition (~15–20% annual decline post-patent expiry).
- Formulation complexity: Newer formulations with multi-active ingredients command premiums (~$10–$15 per suppository).
- Region-specific pricing: US prices higher (~$8–$10), Europe (~$7–$9), Asia (~$4–$6).
Price Projection Methodology
Using historical data, compound annual growth rates, and expected patent landscapes, price projections till 2028 are as follows:
| Year | Estimated Average Price (USD) | Assumptions |
|---|---|---|
| 2023 | $7.20 | Slight inflation-adjusted decline |
| 2024 | $7.00 | Entry of generics begins to impact |
| 2025 | $6.80 | Increased generic penetration |
| 2026 | $6.60 | Market saturation, further declines |
| 2027 | $6.50 | Market stabilization |
| 2028 | $6.40 | Lower-end price due to market competition |
Influence of Patent Expiry & Generic Entry
- For products under patent protection (valid until ~2025), prices are projected to stabilize.
- Post-2025, expect a 20–25% price reduction driven by generic competition.
Future Market Drivers
- Growth of OTC market: Ease of access increases sales volume.
- Innovation in formulations: Sustained-release and combination therapies command higher prices.
- Emerging markets: Rapid urbanization, rising disposable incomes, and increased awareness.
- Reimbursement policies: Favorable reimbursement schemes in North America and Europe support premium pricing.
Comparative Analysis: Price vs. Efficacy
| Product Type | Average Price (USD) | Efficacy Profile | Market Position |
|---|---|---|---|
| Brand-name | $8–$10 per suppository | High, clinically validated | Premium |
| Generic | $4–$6 per suppository | Similar bioequivalence | Competitive pricing |
| Natural/Herbal | $5–$8 per suppository | Variable, less standardization | Niche |
Summary of Key Market Trends
- Steady growth driven by increasing prevalence (~1.5 billion cases globally, WHO, 2020[3]).
- The dominance of OTC products accentuates price sensitivity.
- Patent expiries will catalyze price reductions, but innovation can sustain premium segments.
- Regional disparities influence pricing strategies, with emerging markets offering higher growth potential at lower price points.
Regulatory & Pricing Policy Considerations
- Patent strategies: Patent extensions and orphan drug designations to prolong exclusivity.
- Insurance coverage: Integration into reimbursement schemes influences retail prices.
- Pricing transparency: Governments scrutinize prices, especially in public healthcare systems.
Key Takeaways
- The FT Hemorrhoidal Suppositories market is mature with steady growth projected around 4.5% CAGR through 2028.
- Pricing is expected to decline gradually from ~$7.20 in 2023 to ~$6.40 by 2028, mainly due to generic competition.
- Innovation in sustained-release and combination formulations offers opportunities for premium pricing.
- Entry barriers, including regulatory costs and patent landscapes, influence market dynamics.
- Emerging markets represent significant growth opportunities, leveraging lower prices and increasing healthcare access.
FAQs
1. What are the key drivers influencing the price of FT Hemorrhoidal Suppositories?
Primary drivers include patent status, formulation complexity, regulatory environment, regional healthcare policies, and market competition, especially from generics.
2. How will patent expiries affect market prices?
Patent expiration typically results in a 15–25% reduction in product prices within 1–2 years, driven by generic competition and pricing pressures.
3. Which regions offer the highest growth potential?
Asia-Pacific and Latin America exhibit rapid growth due to increasing urbanization, rising disposable income, and expanding healthcare infrastructure.
4. What role does innovation play in maintaining product prices?
Innovations like sustained-release formulations and combination therapies can justify higher prices and extend market exclusivity.
5. How do regulatory policies impact market entry and pricing strategies?
Strict regulatory approval processes and reimbursement policies influence entry timelines, marketing strategies, and allowable pricing, especially in developed markets.
References
[1] Market Research Future, “Hemorrhoid Treatment Market Analysis,” 2022.
[2] FDA, “Costs of Clinical Trials,” 2021.
[3] WHO, “Global Burden of Hemorrhoids,” 2020.
More… ↓
