Share This Page
Drug Price Trends for FENOFIBRIC ACID DR
✉ Email this page to a colleague
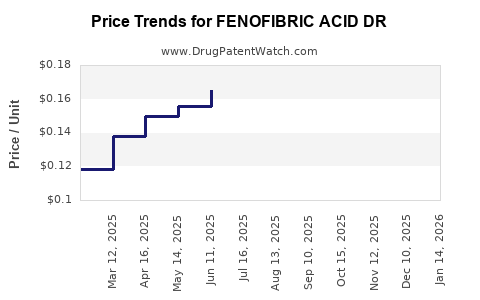
Average Pharmacy Cost for FENOFIBRIC ACID DR
| Drug Name | NDC | Price/Unit ($) | Unit | Date |
|---|---|---|---|---|
| FENOFIBRIC ACID DR 135 MG CAP | 00115-1325-10 | 0.27962 | EACH | 2026-07-22 |
| FENOFIBRIC ACID DR 135 MG CAP | 00115-1555-10 | 0.27962 | EACH | 2026-07-22 |
| FENOFIBRIC ACID DR 135 MG CAP | 42385-0945-90 | 0.27962 | EACH | 2026-07-22 |
| FENOFIBRIC ACID DR 135 MG CAP | 42571-0348-90 | 0.27962 | EACH | 2026-07-22 |
| FENOFIBRIC ACID DR 135 MG CAP | 59651-0217-90 | 0.27962 | EACH | 2026-07-22 |
| >Drug Name | >NDC | >Price/Unit ($) | >Unit | >Date |
Market Overview and Price Projections for Fenofibric Acid DR
Fenofibric Acid DR (delayed release) is a lipid-lowering agent approved for reducing triglycerides, increasing HDL cholesterol, and modifying lipid profiles in patients with hypertriglyceridemia. It is marketed primarily as a generic medication but also as branded formulations such as Trilipix.
Market Status and Demand Drivers
The global market for fibrates, including fenofibric acid derivatives, is driven by growing prevalence of dyslipidemia, increasing cardiovascular disease incidence, and broader adoption of lipid management guidelines. Key demand factors include:
- Dyslipidemia Prevalence: Over 30% of adults worldwide suffer from elevated triglycerides and low HDL levels, creating a significant market need.
- Cardiovascular Disease (CVD): As a risk factor, lipid management remains central to CVD prevention strategies, reinforcing long-term demand for fenofibrate and its derivatives.
- Guideline Endorsements: Organizations like the American Heart Association endorse fibrates as adjuncts in managing mixed dyslipidemia.
- Generic Penetration: The availability of generic fenofibric acid has increased competition but sustained demand due to cost advantages.
Market Size and Revenue Projections (2023–2028)
The global fibrate market was valued at approximately USD 1.4 billion in 2022, with fenofibrate derivatives accounting for a majority share. Fenofibric acid’s segment is projected to grow at a compound annual growth rate (CAGR) of approximately 4% through 2028, reaching USD 1.8 billion by 2028.
Specific to fenofibric acid DR:
| Year | Estimated Market Size (USD Million) | Growth Rate | Remarks |
|---|---|---|---|
| 2023 | 350 | — | Base year |
| 2025 | 440 | 7% CAGR | Mid-term projection |
| 2028 | 530 | 4% CAGR | Long-term projection |
The growth is moderated by generic competition and patent expirations, which diminish branded prices and expand access.
Price Trends and Forecast
Pricing for fenofibric acid DR depends on formulation, brand, and region:
- Brand-name Products: Trilipix (AbbVie) retailed around USD 200–USD 250 per month in the US as of 2022.
- Generic Formulations: Prices vary from USD 35–USD 60 per month, reflecting significant cost reductions.
Projected price decline patterns:
| Year | Estimated Price per Prescription (USD) | Notes |
|---|---|---|
| 2023 | USD 60–USD 70 | Post-patent expiry, late generic entry |
| 2025 | USD 30–USD 45 | Increased generics market share |
| 2028 | USD 20–USD 35 | Further generic consolidation |
The price compression aligns with generic market penetration, which typically halves originator prices within 2–3 years of patent expiration.
Competitive Landscape
Major players in the fenofibrate and fenofibric acid market include:
- AbbVie (Trilipix): Established branded product with strong presence pre-patent expiry.
- Generic Manufacturers: Numerous firms, including Teva, Mylan, and Lupin, offering lower-cost options.
- Pipeline Products: Limited, as fenofibrate derivatives are generics; innovation is slow.
Regulatory and Patent Dynamics
- The US FDA approved fenofibric acid (Trilipix) in 2009.
- Patents expired or are expiring between 2020 and 2023.
- Generics have gained substantial market share since 2020, leading to significant price reductions.
Risks and Opportunities
Risks:
- Patent challenges or litigation.
- Competition from combination therapies (e.g., statins combined with fibrates).
- Shifts toward PCSK9 inhibitors or novel lipid-modulating drugs.
Opportunities:
- Developing combination formulations.
- Expanding access through lower-cost generics.
- Emerging markets presenting growth opportunities due to rising dyslipidemia rates.
Key Takeaways
- The market for fenofibric acid DR is largely driven by dyslipidemia prevalence and CVD management.
- The market size is projected to grow modestly, reaching USD 1.8 billion by 2028 with a CAGR of approximately 4%.
- Price declines are significant post-patent expiry, with generic formulations expected to dominate the market and reduce prices to USD 20–USD 35 per prescription by 2028.
- Competition from generics and alternative lipid-lowering therapies present ongoing challenges, but growth remains available in emerging markets and through new formulation development.
FAQs
1. What is the primary indication for fenofibric acid DR?
It is indicated for hypertriglyceridemia and mixed dyslipidemia to reduce triglycerides and increase HDL cholesterol.
2. How has patent expiry affected the market?
Patent expiry has facilitated a surge in generic options, lowering prices and increasing accessibility.
3. Which regions are expected to see the highest growth?
Emerging markets such as Asia-Pacific and Latin America are expected to see higher growth due to increasing dyslipidemia prevalence and healthcare expansion.
4. Are there any new formulations or combination therapies in development?
Limited innovation exists; most efforts focus on generic manufacturing. Some combination therapies with statins are in exploratory stages but lack approval.
5. How does fenofibric acid compare to other lipid-lowering drugs?
It is mainly used as an adjunct for triglyceride reduction, with a different mechanism than statins or PCSK9 inhibitors. It often complements statins in managing complex lipid profiles.
References
- MarketsandMarkets. "Lipid Management Market," 2023.
- U.S. FDA. "Fenofibric Acid (Trilipix) Approval History," 2009.
- IQVIA. "Global Cardiology Market Data," 2022.
- EvaluatePharma. "Pharmaceutical Price Trends," 2023.
- Statista. "Dyslipidemia Prevalence by Region," 2022.
More… ↓
