Share This Page
Drug Price Trends for EYE DROPS
✉ Email this page to a colleague
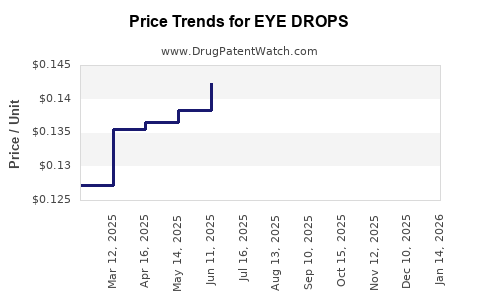
Average Pharmacy Cost for EYE DROPS
| Drug Name | NDC | Price/Unit ($) | Unit | Date |
|---|---|---|---|---|
| EYE DROPS | 24385-0077-05 | 0.14200 | ML | 2026-03-18 |
| EYE DROPS ADVANCED RELIEF | 70000-0456-01 | 0.14200 | ML | 2026-03-18 |
| EYE DROPS | 24385-0075-05 | 0.09689 | ML | 2026-02-18 |
| EYE DROPS | 24385-0077-05 | 0.14200 | ML | 2026-02-18 |
| >Drug Name | >NDC | >Price/Unit ($) | >Unit | >Date |
Market Analysis and Price Projections for Eye Drops
What is the current market landscape for eye drops?
The global eye drops market was valued at approximately $12 billion in 2022. It is projected to grow at a compound annual growth rate (CAGR) of 6.5% from 2023 to 2030, reaching $21 billion by 2030. The growth drivers include increasing prevalence of ocular diseases such as glaucoma, dry eye syndrome, and age-related macular degeneration (AMD), alongside rising aging populations and expanding access to eye care products in emerging economies.
Major manufacturers include Novartis (Alcon), Bausch + Lomb, Johnson & Johnson, Santen Pharmaceutical, and Allergan (acquired by AbbVie). These firms address both prescription and over-the-counter (OTC) segments, with significant diversity in formulations, including lubricants, anti-allergens, antibiotics, and anti-glaucoma agents.
What are the key market segments?
| Segment | Share of market (2022) | Growth prospects |
|---|---|---|
| Prescription eye drops | 60% | Growth driven by chronic conditions like glaucoma |
| OTC eye drops | 40% | Growth driven by dry eye syndrome and allergies |
Prescription eye drops dominate, especially in glaucoma treatment, which accounts for roughly 35% of the global market. OTC products, primarily lubricants and allergy treatments, are expanding due to increased consumer awareness and self-care trends.
What are the regulatory and patent pressures?
Regulatory pathways vary globally. The U.S. FDA expedites approval for certain generics and biosimilars, pressuring brand-name products to lower prices. Patent expirations are critical; key patents for leading drugs like Travatan Z (for glaucoma) expired in the late 2010s, opening markets to generics. Patent cliffs influence pricing, with brand-name drugs experiencing price declines of 20-40% post-expiration.
What are the current price ranges?
Prices vary significantly by formulation, brand, and region. Examples include:
- Brand-name prescribed eye drops: $50-$200 per bottle, depending on the drug and dosage.
- Generic equivalents: $10-$50 per bottle.
- OTC lubricants: $5-$15 per bottle.
In the U.S., prescription eye drops average $125 per bottle for brand name and $20 for generics. In Europe, prices are generally lower, partly due to price controls.
What factors influence future price trends?
- Patent expirations: Lead to price decreases as generics enter the market.
- Regulatory approvals: Facilitate faster market entry for biosimilars and generics, increasing competition.
- Manufacturing innovations: Reduce costs, potentially lowering retail prices.
- Emerging market growth: Expanding access in Asia-Pacific and Latin America may stabilize prices through increased volume but could suppress premium pricing.
How might pricing evolve through 2030?
| Year | Estimated average retail price (per bottle) | Commentary |
|---|---|---|
| 2023 | $50 - $200 | Current prices, brand dominance |
| 2025 | $35 - $180 | Patent expirations impact prices, generic penetration increases |
| 2028 | $25 - $150 | Greater generic availability, volume growth in emerging economies |
| 2030 | $20 - $120 | Price stabilization and increased mass-market penetration |
Price reductions are expected chiefly in the prescription segment, with OTC products displaying relative stability due to lower regulatory hurdles and market saturation.
What are future market opportunities?
- Development of novel formulations with improved bioavailability.
- Growth in biosimilar eye drugs to replace branded biologics.
- Expansion of OTC segments driven by aging demographics and health awareness campaigns.
- Customization via personalized medicine approaches.
What are associated risks?
- Patent litigation delaying generic entry.
- Stringent regulatory barriers in key markets.
- Price controls in some regions reducing profit margins.
- Market saturation in mature segments.
Key Takeaways
- The eye drops market is expanding, driven by demographic shifts and rising ocular disease prevalence.
- Prices are expected to decline in prescription segments due to patent expirations and generics.
- OTC drugs offer stable margins but face commoditization risks.
- Players with innovative products, regulatory agility, or cost advantages will command better margins.
- Emerging markets present growth opportunities despite pricing pressures.
FAQs
Q1: How will patent expirations impact eye drop prices?
Patent expirations introduce generic competition, typically resulting in price declines of 20-40% within 1-3 years post-expiration.
Q2: What are the key drivers of growth in the eye drops market?
Increasing cases of chronic ocular diseases, aging populations, and greater consumer access in emerging economies drive growth.
Q3: Which regions account for the largest market share?
North America holds the largest share, followed by Europe; Asia-Pacific is the fastest-growing due to expanding healthcare access.
Q4: Are biosimilars entering the eye drops market?
Yes. Biosimilars for biologic drugs such as anti-VEGF agents are emerging, creating new competitive dynamics.
Q5: How are pricing strategies differing between OTC and prescription eye drops?
OTC prices are generally stable, reflecting competition; prescription drug pricing is more flexible and susceptible to patent status and health insurance policies.
References
[1] Transparency Market Research. (2022). Eye Drop Market - Global Industry Analysis, Size, Share, Growth, Trends, and Forecast 2023-2030.
[2] Statista. (2023). Global ophthalmic drug market revenue. https://statista.com
[3] IQVIA. (2022). Market Trends in Ophthalmic Pharmaceuticals.
[4] FDA. (2022). Guidance on biosimilar approvals and regulations.
[5] WHO. (2021). Global Data on Vision and Eye Health.
More… ↓
