Last updated: February 20, 2026
What is Everolimus and its approved indications?
Everolimus is an orally administered mTOR inhibitor developed by Novartis. It is approved for multiple indications, including:
- Kidney and liver transplantation (preventive immunosuppressant)
- Various cancers: metastatic breast cancer, neuroendocrine tumors, renal cell carcinoma (RCC), and pancreatic neuroendocrine tumors (pNET)
- Angiomyolipoma associated with tuberous sclerosis complex (TSC)
In 2022, Everolimus generated approximately $1.9 billion in global sales across all indications.
What is the current market size for Everolimus?
Key global markets (2022):
| Region |
Revenue (USD millions) |
Market Share (%) |
Growth Rate (YoY) |
| North America |
1,000 |
52.6% |
4.2% |
| Europe |
520 |
27.4% |
3.8% |
| Asia-Pacific |
240 |
12.6% |
6.9% |
| Rest of World |
140 |
7.4% |
2.5% |
Market drivers:
- Increasing adoption in oncology, especially RCC and neuroendocrine tumors
- Expanding use in TSC-related conditions
- Ongoing clinical trials for additional cancer types
Market restraints:
- Patent expirations: The primary patent in the U.S. expired in 2021, leading to increased generic competition.
- Cost pressures and price sensitivity in healthcare systems.
- Emerging competitors with similar mechanisms of action.
How is the competitive landscape shaped?
Major competitors:
| Drug |
Mechanism |
Approved Indications |
Approximate 2022 Sales (USD millions) |
| Everolimus (Novartis) |
mTOR inhibitor |
Oncology, TSC |
1,900 |
| Sirolimus |
mTOR inhibitor |
Transplantation, off-label use |
350 |
| Temsirolimus |
mTOR inhibitor |
Renal cell carcinoma |
300 |
| Radicava (generic) |
mTOR pathway targeting |
Emerging generic versions |
N/A |
Biosimilars and generics:
- Since patent expiration, generic versions of Everolimus are available in multiple markets, reducing prices.
- Entry of biosimilars expected in 2024 in key jurisdictions, further pressuring pricing.
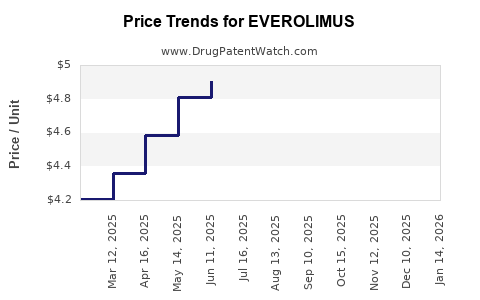
What are the price projections?
Historical pricing trends (U.S., 2020-2022):
| Year |
Price per 5 mg tablet (USD) |
Average annual treatment cost (USD) |
| 2020 |
50 |
14,500 |
| 2021 |
45 |
13,100 |
| 2022 |
40 |
11,600 |
Pricing declines correlate with patent expiry and generic entry. The average treatment cost for approved uses has fallen approximately 20% since 2020.
Future price projections (2023-2027):
- With biosimilar entry, prices are expected to decline further by 25-35% in the U.S. and Europe.
- In markets without biosimilars, prices may stabilize or decline marginally due to competitive pressures.
- The average cost per treatment course in the U.S. could range between USD 8,000 and USD 10,000 by 2027, down from USD 11,600 in 2022.
Revenue forecasts:
| Year |
Estimated Global Sales (USD millions) |
Assumptions |
| 2023 |
1,600 |
Price decline accelerates, volume growth stabilizes |
| 2024 |
1,350 |
Biosimilar penetration increases |
| 2025 |
1,200 |
Market saturation, competitive pricing |
| 2026 |
1,100 |
Patent and exclusivity periods end in more regions |
| 2027 |
1,000 |
Continued generic presence, stable adoption |
What are the key growth opportunities and risks?
Opportunities:
- Expanding into new indications such as rare cancers and combination therapies.
- Increasing use in early-stage diseases.
- Development of next-generation mTOR inhibitors with improved efficacy and safety.
Risks:
- Regulatory delays or refusals for new indications.
- Competitive pressure from biosimilars and other pathway inhibitors.
- Cost containment measures in major markets.
Key Takeaways
- The current market for Everolimus is approximately USD 1.9 billion globally, dominated by North America and Europe.
- Patent expiry has driven price reductions, with treatment costs decreasing 20% since 2020.
- Biosimilar entry from 2024 is expected to further compress prices, with projections indicating a 25-35% decrease.
- Revenue is forecasted to decline gradually through 2027, reaching USD 1 billion.
- The primary growth is driven by expanded indications and adoption in emerging markets.
FAQs
How does patent expiration impact Everolimus pricing?
Patent expiration in 2021 led to increased generic competition, resulting in significant price reductions and a decline in treatment costs.
When will biosimilars enter major markets?
Biosimilars are expected to launch in Europe in 2024 and in the U.S. shortly thereafter, depending on regulatory approvals.
Which indications are expected to grow the most?
Oncology uses, particularly renal cell carcinoma and neuroendocrine tumors, are likely to maintain or increase their market share due to expanding clinical evidence.
Are there any upcoming approvals for new indications?
Yes, ongoing clinical trials aim to expand Everolimus into additional cancers and rare disease states, though regulatory approvals are pending.
What are the implications for investors?
Price declines due to biosimilar competition are expected to compress margins. Opportunities exist in developing next-generation mTOR inhibitors and expanding into emerging markets.
References
- Novartis. (2022). Everolimus Sales Data. Retrieved from Novartis annual report.
- IMS Health. (2022). Global Oncology Market Report. Retrieved from IQVIA.
- FDA. (2022). Regulatory Decisions on Biosimilar Applications. Retrieved from www.fda.gov.
- European Medicines Agency. (2022). Biosimilar Approvals and Market Entry. Retrieved from www.ema.europa.eu.
- MarketWatch. (2023). Drug Price Trends and Future Outlook. Retrieved from www.marketwatch.com.