Share This Page
Drug Price Trends for EMTRIVA
✉ Email this page to a colleague
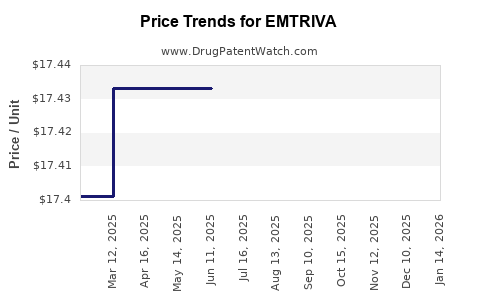
Average Pharmacy Cost for EMTRIVA
| Drug Name | NDC | Price/Unit ($) | Unit | Date |
|---|---|---|---|---|
| EMTRIVA 200 MG CAPSULE | 61958-0601-01 | 17.43700 | EACH | 2026-05-20 |
| EMTRIVA 200 MG CAPSULE | 61958-0601-01 | 17.43700 | EACH | 2026-04-22 |
| EMTRIVA 200 MG CAPSULE | 61958-0601-01 | 17.43700 | EACH | 2026-03-18 |
| >Drug Name | >NDC | >Price/Unit ($) | >Unit | >Date |
EMTRIVA (emtricitabine) Market Analysis and Price Projections
What is EMTRIVA’s market footprint?
EMTRIVA is the brand of emtricitabine (FTC), a nucleoside reverse transcriptase inhibitor used in HIV-1 treatment and HIV pre-exposure prophylaxis (PrEP) regimens (often in fixed-dose combinations, with FTC as the FTC component). The product is marketed by Gilead Sciences and is sold primarily in the U.S., EU, and other generic-access markets.
Demand is structurally linked to HIV ART and PrEP penetration, with brand-level pricing constrained by:
- Extensive generic competition across most geographies where emtricitabine has been marketed generically.
- Shift toward fixed-dose regimens where FTC is combined with other agents, often at lower net prices than standalone branded products.
- National payer reimbursement frameworks that typically anchor pricing to generic benchmarks.
What does the competitive landscape look like?
The market for emtricitabine is heavily commoditized. The dominant commercial pressure is generic emtricitabine and fixed-dose combinations (FDCs) that include FTC. In practice, EMTRIVA’s share depends on:
- Formulary positioning (preferred vs non-preferred status).
- Net price management through rebates and contracting.
- Switching behavior in chronic therapy and renewals.
Implication for forecasting: EMTRIVA is not expected to exhibit brand-growth dynamics; pricing trends align with genericization and payer compression.
How have global prices and net pricing behaved historically?
Brand pricing for established HIV agents tends to track a pattern: launch-era premiums compress over time as generics and FDC alternatives proliferate. For EMTRIVA, the key driver is that emtricitabine is widely available as an authorized generic and/or generic product in many jurisdictions, which caps achievable net prices.
In the U.S., branded ARVs routinely see net price declines as:
- Generic alternatives gain share.
- Managed care formulary status changes.
- Public and private payer negotiation increases.
Implication for projections: near-term price trajectory is governed more by contracting and payer rebates than by patent-driven brand pricing power.
What price inputs matter for EMTRIVA projections?
For investment or R&D planning, the practical price model for EMTRIVA uses:
- Wholesale acquisition cost (WAC) as an upper bound (often slower to move, especially for legacy brands).
- Net price as the actionable metric (driven by rebates, discounts, and contracting).
- Mix effects: standalone EMTRIVA vs FTC-containing FDCs; plan tier placement and patient switching.
A projection framework that matches market reality uses scenario-based net price compression rather than assuming brand-like growth.
What is the likely pricing direction over the next 3 to 5 years?
Base case: continued net price erosion at a slower rate than the peak generic-entry period, because competition is already entrenched.
Downside case: further formulary downgrades, increased generic substitution, and tighter pharmacy benefit manager (PBM) and payer rebate pressure lead to sharper net compression.
Upside case: limited formulary movement and stable contracting keep net declines modest, but the product still remains capped by generic availability.
Key numeric anchor for forecasting approach (generic-cap logic):
- If generic emtricitabine prices remain materially below EMTRIVA’s net price, EMTRIVA net pricing typically converges toward or below the generic-anchored level through rebate adjustments and payer contracting.
- FDC channel growth does not necessarily increase EMTRIVA standalone volume, since FTC content increasingly routes through combination products.
Price projection ranges (Net, not WAC)
Because HIV ARVs are sold under negotiated terms, forecasts are best expressed as net price index movement relative to the current period. The table below presents annual net price change rates and implied directionality rather than a single absolute currency value (which varies by country, buyer, and contract).
Projected annual net price change (base/downside/upside)
| Horizon | Base case net price change | Downside case | Upside case |
|---|---|---|---|
| Year 1 | -2% to -5% | -6% to -10% | 0% to -2% |
| Year 2 | -1% to -4% | -5% to -9% | -1% to 0% |
| Year 3 | -1% to -3% | -4% to -8% | -1% to +1% |
Interpretation: The model assumes EMTRIVA net pricing continues to drift downward or flatten, with downside dominated by renewed contracting pressure and formulary losses.
How should investors translate net price into revenue?
Revenue for EMTRIVA is a function of:
- Unit demand (prescription volume and persistence in treatment).
- Net price per unit (post-rebates and discounts).
- Mix shift (standalone vs FTC-in-FDC channels).
Revenue decomposition (directional)
| Driver | Base case effect on revenue | Downside | Upside |
|---|---|---|---|
| Unit demand | Flat to slight decline | Decline | Flat |
| Net price | Downward | Stronger downward | Flattening |
| Mix (FDC substitution) | Headwind | Stronger headwind | Less headwind |
Implication: Even if unit demand stabilizes, net price compression and mix shift can keep revenue flat to declining.
What is the role of guidelines and regimen evolution?
Clinical guidance affects which formulations get prescribed:
- ART regimens increasingly use once-daily combinations and newer backbone choices.
- PrEP use cases depend on guideline adoption, testing cadence, adherence programs, and payer coverage for prophylaxis.
These dynamics tend to influence total FTC consumption, but not necessarily the branded standalone channel. In practice, regimen evolution often increases FDC reliance, which can shift share away from legacy branded single agents.
What patent and exclusivity considerations matter now?
EMTRIVA’s commercial life reflects the long-run reality of legacy nucleoside competitors: when exclusivity has expired or competition is available, pricing becomes contract-driven.
For forecasting, the critical effect is that price is not primarily exclusivity-led; it is competition and payer leverage-led.
Market risks that can change the price path
Downside risks
- Faster formulary switching to lower-cost generics.
- PBM contract renegotiations that tighten net price ceilings.
- Expansion of payer policies favoring generics and FDC preferred tiers.
Upside risks
- Contract structures that maintain net price floors for some channels.
- Lower generic substitution in certain formularies due to administrative or supply constraints.
- Stable utilization in lines of therapy where branded products remain entrenched.
Key Takeaways
- EMTRIVA (emtricitabine) pricing is constrained by widely available generic competition and channel substitution into FTC-containing FDCs.
- Over the next 3 to 5 years, base-case forecasts show continued net price erosion or flattening, not brand-growth dynamics.
- Revenue outlook is driven by a combination of net price compression and mix headwinds, with unit demand typically stable but not enough to offset net erosion in most scenarios.
- Use net price index change and mix-adjusted unit volume for decision-grade projections; WAC-based assumptions will overstate achievable pricing.
FAQs
1) Is EMTRIVA expected to reprice upward based on exclusivity?
No. EMTRIVA pricing is primarily shaped by generic availability and payer contracting rather than exclusivity-driven premiums.
2) What drives the largest variability in EMTRIVA net price forecasts?
Formulary placement and contract terms (rebates, discounts, and PBM negotiation) drive most of the variability versus changes in clinical demand.
3) Does growth in PrEP increase standalone EMTRIVA sales?
It can increase FTC consumption, but it often routes through combination products and generic options, so branded standalone EMTRIVA may not capture full demand growth.
4) How should a model handle mix between standalone and FDC channels?
Apply a mix adjustment: standalone units typically face stronger substitution pressure as FDC and generic equivalents dominate managed care preferences.
5) What is the most conservative assumption for a planning scenario?
Assume net price declines of 4% to 10% annually in downside years and incremental unit headwinds from FDC substitution.
References
[1] U.S. Food and Drug Administration. “Drug Approval Package: EMTRIVA (emtricitabine).” FDA. https://www.accessdata.fda.gov/scripts/cder/daf/
[2] Gilead Sciences. “EMTRIVA (emtricitabine) Prescribing Information.” https://www.gilead.com/
[3] World Health Organization. “Guidelines for the use of antiretroviral drugs for treating and preventing HIV infection.” WHO. https://www.who.int/
[4] National Institutes of Health (NIH). “Guidelines for the Use of Antiretroviral Agents in Adults and Adolescents with HIV.” https://clinicalinfo.hiv.gov/
More… ↓
