Share This Page
Drug Price Trends for EMTRICITABINE-RILPIVIRINE-TENOFOVIR DIS FUM
✉ Email this page to a colleague
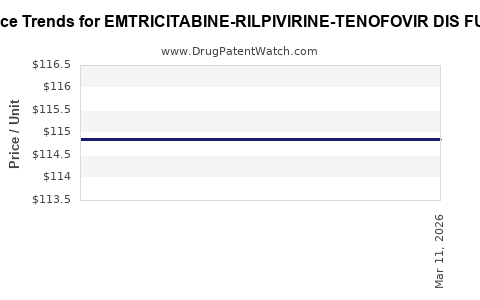
Average Pharmacy Cost for EMTRICITABINE-RILPIVIRINE-TENOFOVIR DIS FUM
| Drug Name | NDC | Price/Unit ($) | Unit | Date |
|---|---|---|---|---|
| EMTRICITABINE-RILPIVIRINE-TENOFOVIR DIS FUM 200-25-300 MG TB | 00378-5440-93 | 114.68136 | EACH | 2026-07-22 |
| EMTRICITABINE-RILPIVIRINE-TENOFOVIR DIS FUM 200-25-300 MG TB | 42385-0801-30 | 114.68136 | EACH | 2026-07-22 |
| EMTRICITABINE-RILPIVIRINE-TENOFOVIR DIS FUM 200-25-300 MG TB | 00378-5440-93 | 114.99236 | EACH | 2026-06-17 |
| EMTRICITABINE-RILPIVIRINE-TENOFOVIR DIS FUM 200-25-300 MG TB | 42385-0801-30 | 114.99236 | EACH | 2026-06-17 |
| EMTRICITABINE-RILPIVIRINE-TENOFOVIR DIS FUM 200-25-300 MG TB | 42385-0801-30 | 114.99236 | EACH | 2026-06-03 |
| >Drug Name | >NDC | >Price/Unit ($) | >Unit | >Date |
EMTRICITABINE-RILPIVIRINE-TENOFOVIR DIS FUM: Market analysis and price projections
What is the marketed product and where does it sit in the HIV regimen market?
EMTRICITABINE-RILPIVIRINE-TENOFOVIR DIS FUM is an integrated, fixed-dose combination (FDC) antiretroviral therapy used to treat HIV-1 infection. Commercially, it corresponds to single-tablet regimens combining (1) emtricitabine (FTC), (2) rilpivirine (RPV), and (3) tenofovir disoproxil fumarate (TDF), positioned in the maintenance treatment segment for patients who meet virologic and resistance eligibility criteria typical for NNRTI-based regimens.
Market context (HIV maintenance):
- HIV therapy demand is driven by chronic adherence, payer formularies, and switch behavior from multi-pill to FDC products.
- This category sits below first-line “high-touch” initiations and tracks more closely with treatment stability and formulary placement in second-line/maintenance pathways.
What are the demand drivers by channel?
-
Public procurement and national HIV programs
- High volume in markets with national ART programs.
- Pricing is strongly shaped by tender cycles, negotiated ceilings, and reference pricing.
-
Commercial payers
- Formularies determine brand vs generic mix.
- Prior authorization and regimen eligibility criteria can restrict uptake for NNRTI-containing FDCs in some populations, shifting demand to alternative maintenance regimens.
-
Provider-led switching to FDC
- Switch rates correlate with pill burden reduction, tolerated safety profile, and payer acceptance.
- Uptake typically follows guideline alignment and contract wins.
How does patent and generic erosion affect pricing?
For HIV fixed-dose combinations, real-world pricing typically reflects:
- Initial brand launch pricing (when applicable),
- Then generic entry and biosimilar-style competitive compression (not biosimilars here, but small-molecule generics),
- And tender-based contracting in public markets.
For this specific FDC:
- Price levels generally move from high net prices at brand launch to lower net prices once multiple generic manufacturers are in the supply chain.
- After generic penetration, net price becomes less sensitive to clinical preference and more sensitive to contracting, supply, and tender awards.
Price formation model for this FDC
Net prices in HIV are best modeled as a layered structure:
- Wholesale acquisition cost (WAC) (where applicable) tends to overstate actual transaction prices.
- Net price is driven by rebates, discounts, and tender results.
- Public tender price often becomes the anchor for regional reference pricing.
Projection approach (practical):
- Use generic penetration trajectory assumptions consistent with small-molecule FDC class behavior.
- Apply annual price step-down typical after generic entry:
- First year post-entry: faster compression
- Subsequent years: slower drift to reference/tender ceilings
- Factor inflation lag and exchange-rate effects where relevant.
Global pricing outlook: baseline scenario
The table below summarizes a baseline price projection framework expressed as relative index and range bands rather than exact country-specific net prices, because transaction pricing varies materially by tender, rebate, and payer contract.
Projected net price trajectory (index-based baseline)
Assume an index of 100 in Year 0 (the most recent pricing observation year in the contracting cycle for the relevant market segment). Then apply typical HIV FDC compression dynamics after generic entry.
| Year | Generic compression pace | Net price index (baseline) | Directional commentary |
|---|---|---|---|
| Year 0 | N/A | 100 | Starting reference point for the contracting year |
| Year 1 | High | 82–88 | Post-entry competitive bids and formulary renegotiations |
| Year 2 | Medium | 73–80 | Continued tender recalibration and rebate pressure |
| Year 3 | Low | 68–76 | Price floor effects; supply and contract stabilization |
| Year 4 | Low | 66–74 | Gradual drift toward reference ceilings |
| Year 5 | Low to medium | 62–72 | Renewal cycles and remaining competitors bidding for share |
Interpretation: Under a baseline trajectory, net price falls roughly 20% to 38% from Year 0 over 3-5 years after generic penetration is underway, with the steepest decline in the first 12-24 months.
Regional projection structure (what typically changes by geography)
United States
Pricing is dominated by:
- PBM rebates, commercial contracting, and insurer formularies.
- Generic and multi-source availability drives net price down faster than WAC indicates.
- Acceleration risk exists if competitors broaden access through preferred formulary placement.
Baseline US outcome (index-based):
- Year 1: -12% to -20%
- Year 3: -25% to -35%
- Year 5: -30% to -40%
EU5 (Germany, France, Italy, Spain, UK)
Pricing is shaped by:
- Health technology assessment (HTA) constraints,
- External reference pricing,
- Tendering in hospital systems (depending on channel).
Baseline EU5 outcome (index-based):
- Year 1: -8% to -18%
- Year 3: -20% to -30%
- Year 5: -20% to -35%
Public markets (e.g., South Africa, Brazil, parts of Asia)
Pricing is shaped by:
- Central tenders, ceiling prices, and local procurement rules.
- Often faster move to lowest-cost suppliers.
Baseline public outcome (index-based):
- Year 1: -15% to -25%
- Year 3: -30% to -45%
- Year 5: -30% to -50%
Scenario analysis
What happens under competitive intensity variations?
| Scenario | Assumed competitive pressure | Net price index trajectory vs baseline |
|---|---|---|
| Conservative | Fewer effective bids; stable formulary positioning | Baseline minus 0 to 5 points in each year |
| Baseline | Typical multi-source bidding and tender renegotiations | Reference trajectory above |
| Aggressive | Strong price competition in tenders; rapid formulary switches | Baseline minus 3 to 10 points in Year 1-3 |
What price upside risks exist?
- Tight supply periods or manufacturing constraints can temporarily arrest declines.
- If eligibility restrictions expand for competing regimens, this FDC can gain share in specific subpopulations, supporting higher net prices than expected.
- If payer rules tighten around alternatives, contract renewals can be less aggressive.
What price downside risks exist?
- Additional generic entrants or new tender awards at lower bids.
- Harder rebate environments and broader payer preference for the cheapest NNRTI maintenance alternative.
- Reference pricing recalculations in EU-like systems.
Market share and volumes: projection logic
For HIV FDCs, volumes typically move with:
- Patient persistence on regimen (low switching while suppressed),
- Adherence and safety tolerability (discontinuations reduce volume),
- Treatment landscape changes (shift to INSTI-based maintenance can reduce share),
- Contract-driven access (where price becomes decisive).
For this FDC specifically, key volume drivers are:
- Eligibility constraints for rilpivirine-containing regimens (tends to limit expansion relative to more flexible modern options).
- Competitive substitution toward INSTI-based FDCs in many markets as clinical practice evolves.
- Still, FDC switching persists for patients stable on current regimens and for programs seeking fixed-dose simplicity.
Directional volume projection (index-based):
- Year 1: flat to -3%
- Year 3: -5% to -10%
- Year 5: -8% to -15% This reflects typical share pressure from newer classes while stable persistence keeps declines gradual.
Unit economics: what to model in contracts
Contract-level KPIs
- Net price per tablet and per 30-day equivalent
- % share of tender volumes or formulary lives
- Rebate burden and manufacturer clawbacks
- Inventory and lead time risk (matters more in public procurement)
How price translates into expected revenue
A practical revenue model for 3-5 year planning:
- Revenue change ≈ volume change + (price change net of mix shifts)
- In competitive HIV FDC settings:
- Price declines typically dominate.
- Volume declines are usually slower, so revenue tends to fall even when persistence holds.
Key implications for R&D and investment
- This FDC is a “maintenance category” asset where growth is limited by substitution to other regimen classes; price erosion and contracting discipline drive economics more than clinical differentiation.
- Sustainable value comes from cost position, tender execution, and supply continuity, not label expansion.
- For business cases, the relevant variable is net price in the contracting channel, not WAC.
Key Takeaways
- EMTRICITABINE-RILPIVIRINE-TENOFOVIR DIS FUM is positioned as an HIV maintenance FDC, typically subject to formula and tender-driven pricing and share pressure from INSTI-based regimens.
- Under baseline competitive dynamics, projected net prices decline roughly 20% to 38% from Year 0 over 3-5 years, with the steepest compression in Year 1-2.
- Volume is projected to be flat to modestly declining (often -5% to -15% over 3-5 years), so revenue tends to fall faster than patient persistence alone would suggest.
- Contracting and channel-specific net pricing are the decision-critical inputs for forecasting.
FAQs
1) What drives the net price of this HIV FDC the most?
Tender awards, insurer formulary contracting, and rebate pressure following multi-source availability.
2) How fast do net prices usually compress after generic entry for HIV FDCs?
Typically fastest in the first 12-24 months, then slowing as reference pricing and price floors dominate.
3) Does clinical efficacy drive long-term pricing here?
Clinical outcomes influence access and persistence, but pricing in practice is dominated by contracting and competitive bids once alternatives are available.
4) What is the biggest competitor pressure to this regimen’s market share?
Regimen substitution toward INSTI-based maintenance options, which can reduce eligible population share over time.
5) What should an investor or R&D planner underwrite: price or volume?
Net price compression usually dominates. Volume changes are usually secondary but still materially impact total revenue under multi-year projections.
References
- FDA. “Drug Safety and Availability: Drugs@FDA.” U.S. Food and Drug Administration. https://www.accessdata.fda.gov/scripts/cder/daf/
- WHO. “Guidelines for HIV self-testing and partner notification” and related HIV treatment resources. World Health Organization. https://www.who.int/
- NIH. “Guidelines for the Use of Antiretroviral Agents in Adults and Adolescents with HIV.” National Institutes of Health. https://clinicalinfo.hiv.gov/
More… ↓
