You're using a free limited version of DrugPatentWatch: Upgrade for Complete Access

Last Updated: April 1, 2026

Drug Price Trends for CALCIUM CARB


✉ Email this page to a colleague

« Back to Dashboard


Drug Price Trends for CALCIUM CARB

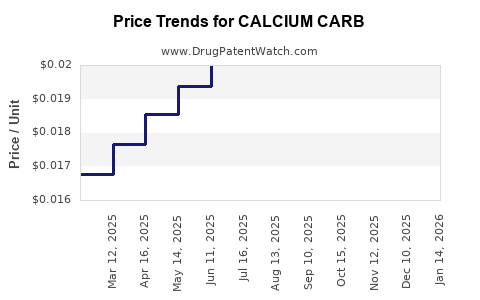
Average Pharmacy Cost for CALCIUM CARB

These are average pharmacy acquisition costs (net of discounts) from a US national survey
Drug Name NDC Price/Unit ($) Unit Date
CALCIUM CARB 1,250 MG/5 ML SUS 00121-0766-16 0.02033 ML 2026-03-18
CALCIUM CARBONATE 648 MG TAB 00536-1206-10 0.00794 EACH 2026-03-18
CALCIUM CARB 1,250 MG/5 ML SUS 00121-0766-16 0.02037 ML 2026-02-18
CALCIUM CARBONATE 648 MG TAB 00536-1206-10 0.00785 EACH 2026-02-18
CALCIUM CARB 1,250 MG/5 ML SUS 00121-0766-16 0.02009 ML 2026-01-21
CALCIUM CARBONATE 648 MG TAB 00536-1206-10 0.00783 EACH 2026-01-21
CALCIUM CARB 1,250 MG/5 ML SUS 00121-0766-16 0.02011 ML 2025-12-17
>Drug Name >NDC >Price/Unit ($) >Unit >Date

Best Wholesale Price for CALCIUM CARB

These are wholesale prices available to the US Federal Government which, by law, must be the best prices available to any customer under comparable terms and conditions
Drug Name Vendor NDC Count Price ($) Price/Unit ($) Unit Dates Price Type
CALCIUM CARBONATE 500MG TAB,CHEWABLE Richmond Pharmaceuticals Inc. 54738-0030-15 150 1.33 0.00887 EACH 2024-02-15 - 2029-02-14 FSS
CALCIUM CARBONATE 1250MG/5ML SUSP,ORAL Golden State Medical Supply, Inc. 00121-4766-05 40X5ML 70.85 2023-06-15 - 2028-06-14 FSS
CALCIUM CARBONATE 1250MG/5ML SUSP,ORAL Golden State Medical Supply, Inc. 00121-4766-05 40X5ML 75.66 2023-06-23 - 2028-06-14 FSS
CALCIUM CARBONATE 1250MG/5ML SUSP,ORAL Golden State Medical Supply, Inc. 00121-0766-16 473ML 6.20 0.01311 ML 2023-06-15 - 2028-06-14 FSS
CALCIUM CARBONATE 1250MG/5ML SUSP,ORAL Golden State Medical Supply, Inc. 00121-0766-16 473ML 6.62 0.01400 ML 2023-06-23 - 2028-06-14 FSS
CALCIUM CARBONATE 500MG TAB,CHEWABLE Geri-Care Pharmaceutical Corp 57896-0763-15 150 2.09 0.01393 EACH 2024-03-16 - 2026-06-14 FSS
>Drug Name >Vendor >NDC >Count >Price ($) >Price/Unit ($) >Unit >Dates >Price Type
Price type key: Federal Supply Schedule (FSS): generally available to all Federal Govt agencies / 'BIG4' prices: VA, DoD, Public Health & Coast Guard only / National Contracts (NC): Available to specific agencies

Market Analysis and Price Projections for Calcium Carbide (CaC2)

Last updated: February 20, 2026

What is Calcium Carbide?

Calcium carbide (CaC2) is an inorganic compound used primarily in industrial applications. It decomposes to produce acetylene gas, which is essential in welding and light manufacturing. It also serves as a precursor in manufacturing chemicals like calcium cyanamide, used in agriculture, and in the production of acetylene for chemical synthesis and lighting.

Market Overview

Global Production and Consumption

  • Estimated global production in 2022: approximately 3.5 million metric tons.
  • Leading producers: China accounts for roughly 70% of global output, followed by India, Russia, and the United States.
  • Consumption sectors:
    • Welding and cutting: 40%
    • Chemical manufacturing: 30%
    • Carbide lamps and other lighting: 10%
    • Agriculture (calcium cyanamide production): 20%

Market Drivers

  • Construction and infrastructure development: Increased demand for welding rods and cutting tools.
  • Chemical industry growth: Expansion in fertilizers and other chemicals.
  • Energy sector activity: Use in carbide lamps, though declining with electric lighting.

Market Challenges

  • Environmental and safety regulations: Stringent controls on production emissions and handling.
  • Supply chain constraints: Particularly for high-grade raw materials.
  • Energy costs: Major energy input in calcining limestone and other raw materials.

Price Trends

Historical Pricing Data (2020–2022)

Year Average Price (USD/ton) Notes
2020 $400 – $650 Prices stabilized before COVID-19 impacts
2021 $600 – $850 Surge driven by increased demand, supply chain issues
2022 $700 – $950 Continued upward trend, high energy prices

Price Influences

  • Raw material costs: Limestone, coke, electricity, and labor influence price.
  • Energy prices: Volatile energy markets impact production costs, especially in China.
  • Environmental policies: Stricter emissions controls may increase manufacturing costs, impacting prices.
  • Export restrictions and tariffs: Affect global trade flows and pricing.

Market Outlook and Price Projections

Short-term (2023–2024)

  • Expected stability with possible moderate price increases of 5–10%, driven by rising energy costs and regulatory compliance expenses.
  • Price range forecast: $750 – $1,050 per ton.

Mid-term (2025–2027)

  • Anticipated growth due to increasing infrastructure projects in emerging markets.
  • Capacity expansions, especially in China, may moderate price increases.
  • Price range forecast: $800 – $1,200 per ton, adjusted for inflation and raw material costs.

Long-term (2028 and beyond)

  • Market saturation may suppress prices unless new applications emerge.
  • Potential technological innovations in alternative welding and chemical synthesis methods could reduce demand.
  • Prices could stabilize around $850 – $1,300 per ton if demand remains steady.

Competitive Landscape

Company Market Share Key Markets Production Capacity (metric tons/year) Remarks
China National BlueStar 25% China, Asia 1.0 million Largest producer
Rashtriya Chemicals & Fertilizers 12% India 420,000 Significant regional player
Osho Chemicals 8% Russia 280,000 Expanding into Asian markets

Policy and Regulatory Environment

  • China: Implements stricter emissions standards, affecting capacity and costs.
  • India: Focuses on self-sufficiency in imports, affecting domestic prices.
  • Europe: Environmental directives increase production costs, impacting prices.

Investment and R&D Trends

  • Focus on cleaner, low-emission production technology.
  • R&D into alternative chemicals and processes that could reduce reliance on traditional calcium carbide.
  • Aerospace and electronics industries explore substitutes for traditional welding processes, affecting future demand.

Key Takeaways

  • Prices for calcium carbide have exhibited volatility due to raw material costs, energy prices, and environmental regulations.
  • China dominates global production; policies there significantly influence global supply and pricing.
  • Growth is expected in emerging markets driven by infrastructure development; however, technological shifts may limit long-term demand.
  • Price forecast suggests incremental increases through 2027, with stabilization potential thereafter.

FAQs

1. What are the main industrial uses of calcium carbide?
Welding and cutting, chemical manufacturing (notably acetylene and calcium cyanamide), and lighting.

2. Which countries are critical in calcium carbide production?
China leads with around 70% of global capacity; others include India, Russia, and the U.S.

3. What factors most influence calcium carbide prices?
Raw material costs, energy prices, environmental regulations, and trade policies.

4. How might environmental policies affect future prices?
Stricter emissions standards could increase production costs and prices; shifts toward cleaner technologies may alter supply dynamics.

5. Are there significant substitutes for calcium carbide in its major applications?
In welding, alternatives exist (e.g., laser welding), but calcium carbide remains dominant due to cost and established infrastructure. In chemical manufacturing, substitutes are limited but under development.


References

[1] MarketsandMarkets. (2022). Calcium Carbide Market. https://www.marketsandmarkets.com/Market-Reports/calcium-carbide-market-283253517.html

[2] Grand View Research. (2022). Calcium Carbide Market Size & Growth. https://www.grandviewresearch.com/industry-analysis/calcium-carbide-market

[3] International Energy Agency. (2022). Energy Prices and Market Trends. https://www.iea.org/reports/energy-price-report

[4] U.S. Geological Survey. (2022). Mineral Commodity Summaries. https://pubs.usgs.gov/periodicals/mcs2022/mcs2022.pdf

More… ↓

⤷  Start Trial

Make Better Decisions: Try a trial or see plans & pricing

Drugs may be covered by multiple patents or regulatory protections. All trademarks and applicant names are the property of their respective owners or licensors. Although great care is taken in the proper and correct provision of this service, thinkBiotech LLC does not accept any responsibility for possible consequences of errors or omissions in the provided data. The data presented herein is for information purposes only. There is no warranty that the data contained herein is error free. We do not provide individual investment advice. This service is not registered with any financial regulatory agency. The information we publish is educational only and based on our opinions plus our models. By using DrugPatentWatch you acknowledge that we do not provide personalized recommendations or advice. thinkBiotech performs no independent verification of facts as provided by public sources nor are attempts made to provide legal or investing advice. Any reliance on data provided herein is done solely at the discretion of the user. Users of this service are advised to seek professional advice and independent confirmation before considering acting on any of the provided information. thinkBiotech LLC reserves the right to amend, extend or withdraw any part or all of the offered service without notice.