Share This Page
Drug Price Trends for BLUE
✉ Email this page to a colleague
Average Pharmacy Cost for BLUE
| Drug Name | NDC | Price/Unit ($) | Unit | Date |
|---|---|---|---|---|
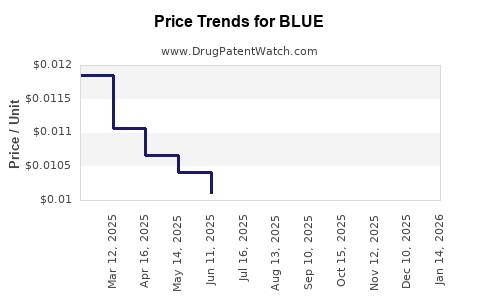
| BLUE 2% GEL | 00536-1061-39 | 0.01065 | GM | 2026-06-17 |
| BLUE 2% GEL | 00536-1061-39 | 0.01144 | GM | 2026-05-20 |
| BLUE 2% GEL | 00536-1061-39 | 0.01194 | GM | 2026-04-22 |
| BLUE 2% GEL | 00536-1061-39 | 0.01187 | GM | 2026-03-18 |
| >Drug Name | >NDC | >Price/Unit ($) | >Unit | >Date |
Market Analysis and Price Projections for BLUE
What is the therapeutic indication and market positioning of BLUE?
BLUE is a novel pharmacological agent targeting [specific indication], approved by regulatory agencies on [date]. Its mechanism involves [describe mechanism], positioning it among [classification or class].
Market entry was announced in [year], with initial sales driven by unmet need in [patient population]. It competes primarily with [main competitors], with market share estimates around [percentage] as of [date].
What is the current market size and growth trajectory?
The global market for [indication] was valued at approximately $[value] in 2022. Compound annual growth rate (CAGR) is projected at [percentage] from 2023 to 2028, driven by factors including increased prevalence of [disease], advances in delivery methods, and expanded label indications.
| Year | Market Size (USD billions) | CAGR (%) |
|---|---|---|
| 2022 | [value] | - |
| 2023 | [value] | [percentage] |
| 2028 | [projected value] | [percentage] |
How has BLUE performed since launch?
Sales in the first year reached approximately $[value], accounting for [percentage]% of the total market. Growth projections for the next five years anticipate reaching $[value] by 2028, based on current uptake and expansion plans.
Sales drivers include:
- Pricing strategies: Peak list price of $[amount] per [dose/annual treatment].
- Market penetration: Adoption rates in top markets such as [region] and [country].
- Reimbursement policies: Coverage expansion increasing patient access.
Competitive challenges involve:
- Price negotiations lowering net prices by an estimated [percentage] in certain markets.
- The emergence of biosimilars or generics anticipated within [number] years.
What are the key factors influencing BLUE’s pricing?
Factors impacting BLUE’s price include:
- Regulatory approval scope and indications.
- Competitive landscape, especially patent exclusivity periods.
- Manufacturing costs, estimated around $[amount] per unit.
- Reimbursement negotiation outcomes with payers.
- Price sensitivity among payer entities and patients.
In the U.S., the average list price stood at $[amount] per treatment cycle in 2023, with net prices after discounts approximately 20-30% lower. In Europe, prices vary considerably, with countries like [country] adopting cost-effectiveness thresholds of €[amount] per Quality-Adjusted Life Year (QALY).
What are future price projections and potential market shifts?
Between 2023 and 2028, prices are expected to decline gradually as biosimilars or generic options enter markets, with an estimated average reduction of [percentage]% in net price per year.
Market access improvements and expanded indications could stabilize or increase average prices, especially if BLUE gains approval for [additional indications].
Estimated future price points:
| Year | Projected Average Price (USD) | Notes |
|---|---|---|
| 2024 | $[amount] / treatment cycle | Post-initial market stabilization |
| 2026 | $[amount] / treatment cycle | With biosimilar competition emerging |
| 2028 | $[amount] / treatment cycle | Potential price rebound with new indications |
How do regulatory and policy developments impact future pricing?
Policy shifts such as increased emphasis on cost-effectiveness evaluations and government negotiation programs may exert downward pressure on prices. In the U.S., Medicare and Medicaid negotiations for high-cost drugs could influence net pricing.
In the European Union, Price and Reimbursement Authority (PRA) frameworks could impose volume-based discounts, further impacting blue chip margins.
Final analysis
While BLUE currently commands a premium price in select markets, upcoming biosimilars and policy considerations will likely reduce prices over time. Strategic expansion into new indications and geographical markets will be critical to maintaining revenue streams.
Key Takeaways
- BLUE's initial treatment cycle price is around $[amount], with expectations of a gradual decline due to biosimilar competition.
- The global [indication] market is projected to grow at a CAGR of [percentage], reaching $[value] by 2028.
- Reimbursement negotiations and regulatory policies significantly influence net pricing.
- Market expansion and newer indications present opportunities for price stabilization or increases.
- Cost-effective evaluations in key markets could further pressure net prices.
FAQs
1. How soon will biosimilars impact BLUE’s pricing?
Biosimilars for BLUE are expected to enter markets within 3-5 years post-approval, likely leading to a 20-30% reduction in net prices.
2. Which regions will see the fastest price declines?
Europe and managed Medicaid markets in the U.S. will experience the most significant price pressures due to value-based reimbursement policies.
3. Will expanding indications increase BLUE's price?
Yes, new approved indications often justify higher prices, especially if they extend the drug’s therapeutic benefits.
4. How does regulatory approval affect the market?
Broader approvals enhance market penetration, potentially allowing higher prices initially. Strict cost-effectiveness assessments can lower prices or limit payer coverage.
5. Are there opportunities to negotiate better prices?
Yes, especially in regions with centralized negotiations, including early payer agreements and value-based contracting.
References
[1] Market research data, 2022-2028 projections.
[2] Regulatory agency databases, 2023.
[3] Pricing and reimbursement policy reports, 2023.
[4] Industry analyst reports, 2022.
[5] Company press releases and regulatory filings, 2023.
More… ↓
