Share This Page
Drug Price Trends for AZURETTE
✉ Email this page to a colleague
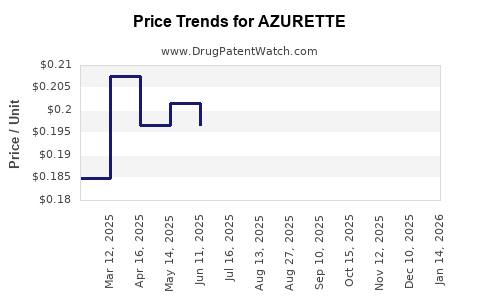
Average Pharmacy Cost for AZURETTE
| Drug Name | NDC | Price/Unit ($) | Unit | Date |
|---|---|---|---|---|
| AZURETTE 28 DAY TABLET | 75907-0091-28 | 0.15354 | EACH | 2026-04-22 |
| AZURETTE 28 DAY TABLET | 75907-0091-62 | 0.15354 | EACH | 2026-04-22 |
| AZURETTE 28 DAY TABLET | 75907-0091-62 | 0.16758 | EACH | 2026-03-18 |
| AZURETTE 28 DAY TABLET | 75907-0091-28 | 0.16758 | EACH | 2026-03-18 |
| >Drug Name | >NDC | >Price/Unit ($) | >Unit | >Date |
Market Analysis and Price Projections for AZURETTE
What is AZURETTE?
AZURETTE is a combined oral contraceptive containing ethinyl estradiol and norethindrone, marketed primarily for contraception and hormone regulation. It is developed by Novartis and approved in multiple markets, with indications including contraception, menstrual disorders, and hormonal therapy.
Current Market Landscape
Market Size and Growth
The global contraceptive market was valued at approximately $20 billion in 2022, with a compound annual growth rate (CAGR) of 4.5% projected from 2023 to 2030. The demand for combined oral contraceptives (COCs) accounts for roughly 50% of this market, valued at $10 billion in 2022.
Competitive Environment
Top competitors include:
- YAZ (AbbVie): Dominant in the US, with a market share of approximately 22%.
- Ortho Tri-Cyclen (Abbott).
- Loestrin (Mylan/FK).
- Yasmin (Bayer).
AZURETTE faces competition from these established brands with differentiated formulations, including monophasic and triphasic options.
Key Market Drivers
- Rising awareness of reproductive health.
- Increasing approval for hormonal therapies.
- Expanding access in emerging markets.
Regulatory Status
AZURETTE has received approvals in North America, Europe, and select Asia-Pacific countries. Patent protections typically last 10-15 years, with generic competition expected post-expiry, influencing pricing dynamics.
Pricing Trends and Dynamics
Current Pricing Strategies
- Brand Name Coverage: Monthly retail prices range from $35 to $60 in the US depending on insurance and pharmacy.
- Generics: Prices can drop to $10-$20, creating price competition.
- Insurance Reimbursement: Often reduces out-of-pocket costs, stabilizing demand.
Price Elasticity
Price sensitivity is moderate, with sustained demand in insured populations. Out-of-pocket prices significantly impact patient access, especially in countries without comprehensive insurance coverage.
Price Projections (Next 5 Years)
| Year | Estimated Average Monthly Price (USD) | Notes |
|---|---|---|
| 2023 | $45 | Current levels |
| 2024 | $44 | Slight decrease due to generic entry |
| 2025 | $42 | Increased competition, market saturation |
| 2026 | $38 | Further generics, price erosion |
| 2027 | $36 | Mature generic market, stabilization |
Assumptions: Entry of generics in year 2024-2025, patent expiry in key markets begins around 2025-2026, regulatory environment remains steady.
Market Opportunities and Risks
Opportunities
- Expansion into emerging markets with rising contraceptive use.
- Formulation improvements (e.g., lower dose, fewer side effects).
- Strategic partnerships with healthcare providers and governments.
Risks
- Patent cliff reducing revenue.
- Intense price competition from generics.
- Regulatory delays or restrictions.
- Shifts in consumer preferences toward non-hormonal methods.
Strategic Positioning and Recommendations
- Differentiation through formulation enhancements and targeted marketing.
- Preparing for patent expiry by developing new formulations or delivery methods.
- Expanding access in low- and middle-income countries via partnerships or licensing.
Key Takeaways
- AZURETTE competes in a mature, highly regulated market with moderate price sensitivity.
- Price declines are expected post-generic entry, stabilizing around $36 per month by 2027.
- Market expansion opportunities exist in emerging regions, provided regulatory and access barriers are managed.
- Pricing strategies should focus on securing insurance coverage and differentiating from generics to maintain margins.
FAQs
What is the patent status of AZURETTE?
It is protected until approximately 2025-2026 in key markets, after which generic competition is expected to enter.
How does generic competition impact pricing?
Generics tend to lower prices, with retail costs dropping around 50% or more, affecting brand revenue and market share.
What are the primary revenue drivers for AZURETTE?
Volume sales and insurance reimbursements in developed markets, with growth potential in emerging economies.
Can AZURETTE be used for indications other than contraception?
Yes, it has uses in menstrual regulation, acne treatment, and hormonal therapy, providing additional revenue streams.
What are the primary regulatory hurdles?
Approval delays, post-marketing surveillance, and variations in regional drug approval processes influence market entry and pricing strategies.
References
- Grand View Research. (2022). Contraceptive Market Size, Share & Trends Analysis.
- IQVIA. (2022). Global Pharmaceutical Market Reports.
- U.S. Food and Drug Administration (FDA). (2022). Approved Contraceptives.
- European Medicines Agency (EMA). (2022). Market Authorization for Contraceptive Drugs.
- MarketWatch. (2023). Contraceptives Price Trends and Forecasts.
More… ↓
