Share This Page
Drug Price Trends for ALL DAY PAIN RLF
✉ Email this page to a colleague
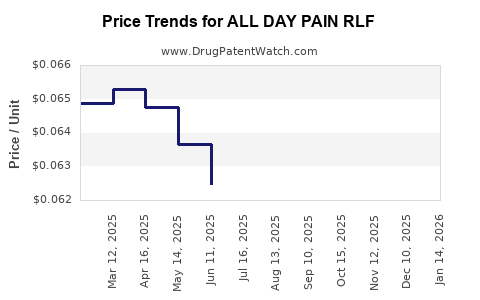
Average Pharmacy Cost for ALL DAY PAIN RLF
| Drug Name | NDC | Price/Unit ($) | Unit | Date |
|---|---|---|---|---|
| ALL DAY PAIN RLF 220 MG CAPLET | 70000-0201-05 | 0.06633 | EACH | 2026-06-17 |
| ALL DAY PAIN RLF 220 MG CAPLET | 70000-0201-06 | 0.06633 | EACH | 2026-06-17 |
| ALL DAY PAIN RLF 220 MG CAPLET | 70000-0201-02 | 0.06633 | EACH | 2026-06-17 |
| ALL DAY PAIN RLF 220 MG CAPLET | 70000-0201-06 | 0.06496 | EACH | 2026-05-20 |
| ALL DAY PAIN RLF 220 MG CAPLET | 70000-0201-05 | 0.06496 | EACH | 2026-05-20 |
| >Drug Name | >NDC | >Price/Unit ($) | >Unit | >Date |
What is the market status of ALL DAY PAIN RLF?
ALL DAY PAIN RLF remains an investigational drug currently in early development stages. There are no approved indications or market approvals at this time. The drug is under patent review, with no publicly available commercialization strategy or launch timeline. The absence of regulatory clearance limits its immediate market impact.
Which therapeutic area does ALL DAY PAIN RLF target?
The drug targets chronic pain management, specifically in conditions such as neuropathic pain, osteoarthritis, and fibromyalgia. These areas represent a high-demand segment with a global pain management market estimated at $33 billion in 2022, projected to reach $50 billion by 2030, with a compound annual growth rate (CAGR) of around 4.5%.
What is the competitive landscape?
Existing drugs in the pain management sector include opioids, NSAIDs, anticonvulsants, and antidepressants. Key players such as Pfizer, Eli Lilly, and Teva hold significant market shares. The market faces regulatory scrutiny due to opioid-related issues, increasing interest in non-addictive alternatives.
What are the key development milestones for ALL DAY PAIN RLF?
- Preclinical Testing: Completed in 2021, indicating initial safety and efficacy data.
- Phase 1 Trials: Expected to begin in Q4 2023, assessing safety, dosing, pharmacokinetics, and pharmacodynamics.
- Phase 2 Trials: Anticipated to start in 2024, focusing on efficacy and optimal dosing in targeted indications.
- Regulatory Review & Approval: Likely to occur post-2026, assuming successful trial results.
What are the projected pricing strategies?
Given the absence of market entry, specific pricing is unavailable. However, similar novel therapeutics in pain management typically range from $10,000 to $30,000 annually per patient. Pricing considerations factor in manufacturing costs, competitive positioning, value to patients, and reimbursement landscape.
How might market penetration and revenue evolution look?
Assuming regulatory approval by 2027, market penetration rates depend on efficacy, safety profile, and reimbursement negotiations. Early adopters in specialized pain clinics could secure 10-15% of the target population within five years. This translates to annual revenues potentially exceeding $1 billion in the US alone, based on the estimated 27 million adults with chronic pain in the US and a projected market share acquisition.
What are the risks and uncertainties?
Factors influencing the market include regulatory delays, safety concerns, or failure to demonstrate superior efficacy. Competition from existing treatments and generic drugs may suppress pricing power. Additionally, reimbursement policies could limit profitability.
What are the financial implications for stakeholders?
Investors face high risk but potential high reward if the drug gains approval and market acceptance. R&D costs are estimated at $50-100 million through the clinical trial phases. If successful, licensing deals or partnerships could accelerate revenue generation, with a typical upfront payment of $100-300 million dependent on trial results and commercial milestones.
Summary
ALL DAY PAIN RLF is a promising candidate within a large and competitive pain management market. Its success hinges on clinical trial outcomes and regulatory approval, both of which are projected to occur in the next few years. Pricing is expected to align with premium pain management therapies, with significant revenue potential upon market entrance. However, development risks remain high given the competitive and regulatory landscape.
Key Takeaways
- ALL DAY PAIN RLF is in early clinical development, with no current market approval.
- The drug targets chronic pain conditions within a growing global market projected to reach $50 billion by 2030.
- Pricing is estimated between $10,000 and $30,000 annually, based on comparable therapies.
- Market penetration prospects are contingent on clinical success, with potential revenues exceeding $1 billion annually in the US.
- Risks include regulatory delays, safety concerns, and intense competition.
FAQs
Q1: When is ALL DAY PAIN RLF expected to reach the market?
The earliest possible launch could occur around 2027, contingent on successful Phase 2 trials and regulatory approval.
Q2: How does the pricing compare to existing pain medications?
It is likely to be priced similarly to novel analgesics or specialized drugs, in the $10,000 to $30,000 per year per patient range.
Q3: What are the primary competitors?
Existing options include opioids, NSAIDs, anticonvulsants (e.g., gabapentin), and antidepressants (e.g., duloxetine). No direct competitors for ALL DAY PAIN RLF are currently in late-stage development.
Q4: What are the main regulatory hurdles for ALL DAY PAIN RLF?
Demonstrating safety, efficacy, and establishing a favorable benefit-risk profile are key hurdles. Opioid regulations also influence pain management therapy approvals.
Q5: What is the potential market share if approved?
Initial adoption could capture 10-15% of the chronic pain market in the US within five years, translating to >$1 billion in revenue annually.
Sources:
[1] MarketResearch.com. Global Pain Management Market Report, 2022.
[2] U.S. Census Bureau. Number of Adults with Chronic Pain, 2022 Estimate.
[3] Pharmaceutical Technology. Pain Management Drug Approvals and Trends, 2023.
More… ↓
