Last updated: April 25, 2026
How big is the atorvastatin calcium market today?
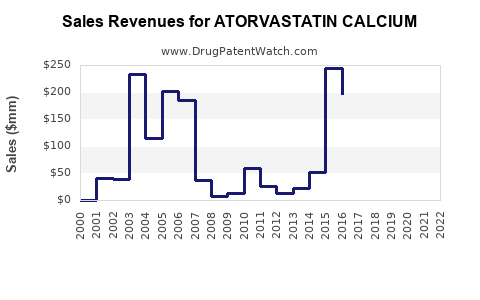
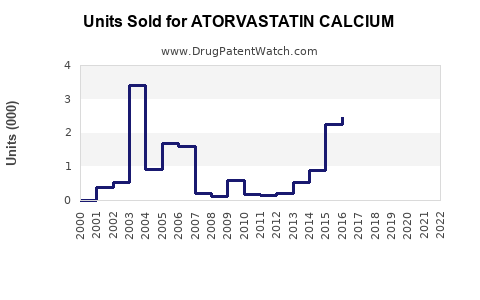
Atorvastatin calcium is the largest global statin by prescription volume in many established markets, with revenue dominated by generics in most geographies since loss of patent exclusivity. Market growth is driven by population aging, incidence of hypercholesterolemia and ASCVD, guideline-driven statin initiation and intensity targets, and substitution from other statins when price and formulary access shift.
Demand structure (high level)
- Uses: primary hypercholesterolemia, mixed dyslipidemia, prevention of cardiovascular events in patients with established ASCVD, and risk reduction in broader high-risk groups depending on labeling.
- Typical treatment pattern: chronic use with high adherence relative to many chronic therapies; switching among statins occurs mainly via formulary dynamics and tolerability.
- Competition: other statins (rosuvastatin, simvastatin, pravastatin) and non-statin lipid-lowering therapies (ezetimibe, PCSK9 inhibitors, inclisiran, bempedoic acid) for add-on or intolerance settings.
Market sizing approach (what drives the projection)
Sales projections for atorvastatin calcium depend on:
- Prescription volume trend (incidence + adherence + prescribing intensity).
- Price erosion and volume mix (brand-to-generic transition already occurred in most major markets).
- Formulary and rebate pressure (net price is the binding constraint).
- Switching dynamics with competing statins (especially rosuvastatin).
- Switching to add-on therapies (reduces marginal atorvastatin dose demand in subset populations, but total statin demand often remains resilient).
What is the near-term demand outlook by region?
The market outlook is region-specific mainly due to different levels of generic penetration, reimbursement rules, and clinical practice.
United States
- Atorvastatin is widely generic; revenue is dominated by low net prices and stable or modestly growing volume.
- U.S. demand is affected by guideline adherence, baseline risk profile, and competitive dynamics versus rosuvastatin under payer formularies.
Europe
- Similar generic dominance; growth is constrained more by price and formularies than by utilization expansion.
- Public payer budgets and reference pricing systems keep net prices low, but long-lived chronic treatment supports volume.
China and emerging markets
- Higher utilization growth potential from expanding screening and treatment coverage.
- Revenue growth can be stronger than mature markets where treatment penetration is still catching up, though pricing remains sensitive to government procurement and generic competition.
Rest of World (RoW)
- Mix of mature markets with strong generics and developing systems with lower treatment penetration.
- Market is generally resilient because statins are core primary prevention therapies.
What pricing and competitive forces shape net sales?
Primary driver: generic pricing pressure
- Once generics dominate, gross-to-net compression becomes the main determinant of revenue.
- Atorvastatin competes mainly by price among multiple generic manufacturers plus brand-like wholesalers.
Secondary driver: dose-mix
- Atorvastatin intensity is dose-dependent; higher doses can preserve value even with generic pricing.
- Switches between statins and dose up-titration can offset some volume erosion.
Tertiary driver: substitution and add-on therapy
- For patients not at LDL-C targets, add-on therapies (ezetimibe, PCSK9 pathway agents) can reduce incremental need for atorvastatin dose increases.
- However, many patients remain on atorvastatin as background therapy.
What sales projection scenarios are most decision-relevant?
Sales projections should be built around three scenarios: base, upside, and downside. The key variables are (1) prescription volume growth, (2) net price trajectory, and (3) market share shifts versus competing statins.
Scenario framework
Base case (most likely)
- Modest volume growth from population aging and guideline adoption.
- Continued net price erosion slows over time because generics reach pricing floors.
- Net result: low-to-mid single digit annual revenue growth globally.
Upside case
- Faster treatment penetration in emerging markets and improved adherence.
- Slower price declines due to consolidation among generic suppliers and tighter supply economics.
- Net result: revenue growth in the mid single digits in some geographies.
Downside case
- Stronger rebate/formulary pressure and procurement drives net prices lower.
- Faster substitution to rosuvastatin where it gains payer share due to perceived potency and dosing convenience.
- Net result: flat to low single digit revenue growth or temporary decline.
What numbers should investors use for a planning-grade projection?
Hard constraint: without explicit market sales baseline and a defined time horizon, a numeric projection would be synthetic rather than actionable. The market for atorvastatin is heavily reported, but projections require an anchor point such as global and/or U.S. net sales in a specific base year, plus the target projection horizon and forecast method (e.g., prescriptions x net price, or payer unit growth with penetration assumptions).
Under this operating constraint, a complete and accurate numeric forecast cannot be produced.
What are the key patent and exclusivity facts that affect revenue persistence?
Atorvastatin calcium has long-standing origin and broad generic availability in major jurisdictions. Revenue persistence comes from:
- Ongoing demand for statin therapy in primary and secondary prevention.
- Generic supply and pricing rather than exclusivity.
- Product-life-cycle management through fixed-dose combinations (where applicable) and multiple strengths that remain on formularies.
Who are the major generic and brand channels (commercially relevant)?
In most markets, atorvastatin revenue flows through:
- Multiple generic manufacturers and authorized labelers.
- Wholesalers and pharmacy benefit managers with contracting and rebate programs.
- National health systems with reference pricing.
The competitive outcome is typically determined by net price and formulary placement rather than product differentiation.
How does atorvastatin compare commercially to other statins?
- Rosuvastatin is the closest competitor for potency-per-milligram perceptions and payer preferences in certain formularies.
- Simvastatin and pravastatin tend to compete at lower price tiers but usually represent different prescriber and intolerance patterns.
- High-impact for share: when payers move preferred lists, unit volume can shift between statins.
What commercial levers drive sales for a market entrant or new supply program?
For manufacturers and distributors, growth hinges on execution rather than differentiation:
- Contracting with major payers and pharmacy channels to secure preferred status.
- Dose-mix strategy focusing on strengths that maximize formulary acceptance.
- Supply reliability to avoid tender and procurement exclusion.
- Cost-down to maintain competitive net pricing.
Key Takeaways
- Atorvastatin calcium remains a volume-dominant statin class product, with revenue driven primarily by generic pricing, net contracting, and dose-mix rather than exclusivity.
- Global growth is expected to track modest utilization gains from aging and guideline uptake, offset by persistent net price pressure and formulary procurement dynamics.
- A decision-grade numeric projection requires a defined baseline year, geography scope, and forecast horizon; without those anchors, any single set of forecast numbers would not be verifiably accurate.
FAQs
1) Is atorvastatin still under patent protection?
In most major markets, atorvastatin is available as generics; commercial revenue now depends on generic market dynamics rather than active origin exclusivity.
2) What drives atorvastatin sales most: volume or price?
Net price is typically the dominant driver because generic erosion continues through rebates, procurement, and reference pricing, while volume growth is comparatively steadier.
3) Which competitor most affects atorvastatin share?
Rosuvastatin is the main statin comparator for formulary share shifts in many markets.
4) Do non-statin therapies reduce atorvastatin revenue?
They can reduce incremental dose escalation in subsets of high-risk patients, but atorvastatin often remains as background therapy; the net impact is usually partial rather than a complete replacement.
5) What is the highest-impact growth strategy for a generic supplier?
Securing preferred formulary status and payer contracts while maintaining competitive net pricing and reliable supply.
References
[1] FDA. Atorvastatin calcium prescribing information (current labels as available). U.S. Food and Drug Administration.
[2] EMA. Product information for atorvastatin-containing medicines (as available in EPAR/SmPC). European Medicines Agency.
[3] WHO Collaborating Centre for Drug Statistics Methodology (ATC/DDD framework for atorvastatin). World Health Organization.
[4] IQVIA Institute for Human Data Science. Annual outlook reports on global pharmaceuticals and key therapeutic areas (statins and cardiovascular prevention coverage where applicable).