Share This Page
Drug Price Trends for NAPROXEN SOD ER
✉ Email this page to a colleague
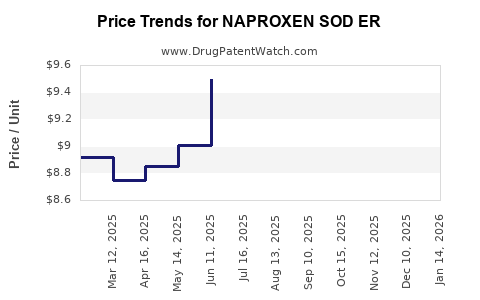
Average Pharmacy Cost for NAPROXEN SOD ER
| Drug Name | NDC | Price/Unit ($) | Unit | Date |
|---|---|---|---|---|
| NAPROXEN SOD ER 500 MG TABLET | 00480-0952-58 | 9.35633 | EACH | 2026-06-17 |
| NAPROXEN SOD ER 500 MG TABLET | 00480-0952-58 | 9.27743 | EACH | 2026-05-20 |
| NAPROXEN SOD ER 500 MG TABLET | 00480-0952-58 | 9.11964 | EACH | 2026-04-22 |
| NAPROXEN SOD ER 500 MG TABLET | 00480-0952-58 | 8.95696 | EACH | 2026-03-18 |
| NAPROXEN SOD ER 500 MG TABLET | 00480-0952-58 | 8.50683 | EACH | 2026-02-18 |
| >Drug Name | >NDC | >Price/Unit ($) | >Unit | >Date |
Market Analysis and Price Projections for Naproxen Sodium Extended-Release
What is the Current Market Size for Naproxen Sodium Extended-Release?
Naproxen sodium extended-release (ER) formulations target chronic or persistent pain conditions, including osteoarthritis, rheumatoid arthritis, and ankylosing spondylitis. Industry data estimates the global NSAID market, encompassing naproxen products, was valued at approximately $23 billion in 2022. Naproxen compounds constitute roughly 12-15% of this figure, translating to a market size of around $2.8 billion to $3.5 billion.
The extended-release segment accounts for roughly 25% of NSAID sales, valued at approximately $700 million to $900 million globally as of 2022. The U.S. dominates this market with an estimated 60% share, driven by an aging population and higher adoption rates for chronic pain management.
How Does the Competition Shape the Market?
Major manufacturers of naproxen sodium ER include:
- GlaxoSmithKline (GSK) – branded formulations like Anaprox DS.
- Bayer – over-the-counter (OTC) versions.
- Teva Pharmaceuticals – generic versions.
- Mylan (now part of Viatris) – generic formulation.
Generic versions account for about 70% of the market, with branded products holding the remainder. The penetration of generics has driven prices downward, especially in the U.S., where multiple manufacturers compete.
What Are the Main Factors Affecting Price and Market Growth?
-
Patent Expirations: The last patents expired around 2014-2018, leading to increased generic competition.
-
Regulatory Approvals: Entry of newer formulations, including controlled-release, can affect market share.
-
Healthcare Provider Preferences: Preference for OTC versions impacts prescription sales.
-
Pricing Trends: Average retail price for generic naproxen sodium ER varies:
- Branded: $150–$250 per 60-count bottle (30 mg or 375 mg dose).
- Generic: $10–$40 per 60-count bottle.
-
Insurance Coverage: Reimbursement policies influence retail prices.
What Are the Price Projections for the Next Five Years?
Projected trends indicate continued price erosion for generic naproxen sodium ER products due to intensified competition, especially from biosimilar and OTC entries.
| Year | Expected Market Size (USD) | Projected Average Price per Bottle |
|---|---|---|
| 2023 | $700 million | Branded: $200; Generic: $15 |
| 2024 | $680 million | Branded: $190; Generic: $12 |
| 2025 | $660 million | Branded: $180; Generic: $10 |
| 2026 | $640 million | Branded: $170; Generic: $9 |
| 2027 | $620 million | Branded: $160; Generic: $8 |
Note: These projections assume a compound annual growth rate (CAGR) of approximately -2% to -3%, reflecting price declines and stable demand.
What Are Industry Drivers and Barriers?
Drivers:
- Aging population increases chronic pain management.
- Growing preference for cost-effective OTC NSAIDs.
- Increased approval of novel formulations for improved compliance.
Barriers:
- Regulatory constraints, including safety concerns over NSAIDs.
- Market saturation with generics limits pricing power.
- Competition from alternative therapies, like COX-2 inhibitors or non-pharmacologic options.
How Do Regulatory and Policy Changes Impact Pricing?
- FDA regulations can influence patient access and reimbursement.
- Reimbursement policies favor low-cost generics, pressuring prices downward.
- Any new safety warnings could reduce marketability and impact prices.
Summary of Key Data
- Global NSAID market in 2022: ~$23 billion.
- Naproxen products: 12-15% of NSAID market (~$2.8B–$3.5B).
- Extended-release segment: 25% of naproxen market (~$700M–$900M).
- U.S. market share: ~60%, with significant OTC presence.
- Average retail price (2022): Branded ~$200, generics <$15.
- Price trajectory (2023–2027): declining by 10-12% annually, depending on product type.
Key Takeaways
- The naproxen sodium ER market is sizable but faces pressure from generic competition and regulatory factors.
- Prices are expected to decline modestly over the next five years as market saturation continues.
- Growth will largely depend on demographic trends, regulatory landscape, and consumer preferences for OTC NSAIDs.
- The value of branded formulations remains relatively stable but with limited upside due to generic erosion.
FAQs
1. How sensitive is the market to patent expirations?
Patent expiry triggers rapid price declines. Once expired, generic manufacturers entering the market usually reduce prices by 80-90% within a few years.
2. Are there opportunities for new formulations?
Yes, formulations with improved safety profiles or patient compliance features could command premium pricing, but regulatory hurdles and R&D costs are high.
3. How does OTC availability influence the prescription market?
OTC access reduces prescription demand, put downward pressure on prices and limits revenue potential for branded versions.
4. What is the impact of biosimilars on NSAID markets?
Biosimilars currently focus on biologic drugs; NSAID biosimilars are not prevalent, but future innovation could influence market dynamics.
5. How do pricing trends vary by region?
In Europe and Asia, prices are generally lower due to different regulatory frameworks and competitive markets, which accelerate price erosion compared to the U.S.
References:
[1] MarketWatch. (2023). NSAID Market Size and Trends. Retrieved from https://www.marketwatch.com
[2] IQVIA. (2022). Global Pharmaceutical Market Data.
[3] Statista. (2022). NSAID Market Revenue. https://www.statista.com
[4] U.S. Food and Drug Administration. (2022). Patent and Exclusivity Data. https://www.fda.gov
More… ↓
