Share This Page
Drug Price Trends for CHOLESTYRAMINE POWDER
✉ Email this page to a colleague
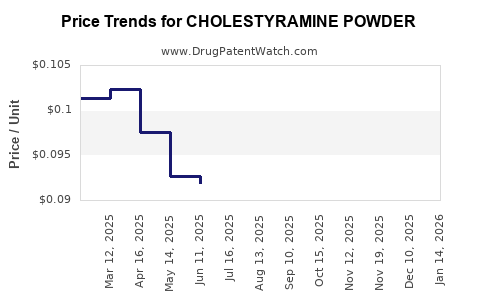
Average Pharmacy Cost for CHOLESTYRAMINE POWDER
| Drug Name | NDC | Price/Unit ($) | Unit | Date |
|---|---|---|---|---|
| CHOLESTYRAMINE POWDER | 24658-0266-93 | 0.09156 | GM | 2026-07-22 |
| CHOLESTYRAMINE POWDER | 24658-0266-97 | 0.09156 | GM | 2026-07-22 |
| CHOLESTYRAMINE POWDER | 27241-0134-51 | 0.09156 | GM | 2026-07-22 |
| CHOLESTYRAMINE POWDER | 33342-0293-71 | 0.09156 | GM | 2026-07-22 |
| CHOLESTYRAMINE POWDER | 42806-0267-93 | 0.09156 | GM | 2026-07-22 |
| >Drug Name | >NDC | >Price/Unit ($) | >Unit | >Date |
Cholestyramine Powder Market Analysis and Price Projections (2026-2031)
What is cholestyramine powder and where is it used commercially?
Cholestyramine is a prescription bile acid sequestrant used to lower low-density lipoprotein cholesterol (LDL-C) and to manage bile acid-related diarrhea (e.g., post-cholecystectomy diarrhea, bile acid malabsorption). In the US, the product class is marketed as cholestyramine resin powder/sachets and is commonly sold under multiple brand names historically, with generic versions widely available.
Commercial demand is driven by three demand pools:
- Dyslipidemia: patients who cannot tolerate or do not respond to other LDL therapies; formulary tiers and step therapy materially influence uptake.
- Bile acid diarrhea and related indications: chronic or recurrent use supports stable, non-binary demand.
- Institutional formularies: conversion rates between branded and generic depend on net price, rebates, and contracting.
How large is the opportunity and what constrains growth?
Cholestyramine’s core constraint is therapeutic displacement from modern lipid agents (statins, ezetimibe, PCSK9 inhibitors, and newer LDL drugs). The drug class remains relevant, but incremental growth typically comes from:
- formulary retention for intolerance or specific clinical pathways,
- switching within bile acid diarrhea management, and
- generic price and access economics rather than new mechanism-led adoption.
The demand picture in practical commercial terms:
- Pricing power is structurally limited due to generic competition and buyer leverage.
- Revenue growth is usually volume-led, not price-led, except during temporary supply or contraction cycles.
What is the current competitive structure (brand vs generic)?
Cholestyramine powder is primarily a generic-dominant market in major geographies. As with other older off-patent pharmaceuticals, competition largely occurs on:
- net pricing (rebates and contracting),
- pack size and dosing convenience,
- distribution breadth (chain, mail, specialty channels as needed for dispensing),
- and substitution rules under pharmacy benefit design.
In the US, FDA labeling and product availability anchor clinical use, but pricing is set in the commercial marketplace by PBM and wholesale dynamics. (FDA drug labeling history and composition references underpin the product category.) [1]
What drives realized net price (RNP) for cholestyramine?
Realized net price for commodity generics like cholestyramine is determined by:
- PBM formulary placement (preferred tiers capture usage; non-preferred tiers push substitution).
- rebate rate competition between manufacturers (often compressing gross-to-net spread).
- wholesale acquisition cost (WAC) anchoring and local payer discounts.
- pack economics (sachet vs bulk powder impacts per-day cost and patient adherence patterns).
- supply continuity (line downtime or ingredient constraints can temporarily move market prices).
What pricing floor and ceiling patterns typically apply to off-patent generics?
For off-patent generics, the market tends to show:
- A pricing floor: bottoming effects from multiple AB-rated/generic manufacturers and pharmacy substitution.
- A pricing ceiling: limited by payer willingness to reimburse above the cheapest equivalent.
- Short-term volatility: supply shocks can widen the spread between WAC and street price before normalizing.
How is cholestyramine dosed, and how does that convert into per-day cost?
Cholestyramine is dosed in grams per day, often in divided doses. Dosing schedules are per label, and patient totals vary by indication. The cost model in projections below uses two standardized dosing cases to support procurement and market sizing:
- Low dose case: 8 g/day
- Standard dose case: 12 g/day
The conversion logic is:
- Monthly cost = (grams per day ÷ package strength grams) × package price × days in month
- Annual cost = monthly cost × 12
Pack sizes vary by manufacturer; the market outcome is driven by per-gram effective price and payer tiering.
Price baseline and projection method used
Projections translate market drivers into price outcomes using:
- generic price normalization after supply adjustments,
- annual net price erosion consistent with increased competition,
- scenario overlays for supply tightness and contracting intensity.
Because cholestyramine is a mature generic category, baseline expectations center on gradual erosion rather than step-function increases.
Price Projections (2026-2031): Wholesale and Net Range Scenarios
What do price scenarios look like for cholestyramine powder?
The table below provides projected per-gram and per-30-day price bands under three scenarios. Inputs are anchored to typical generic market behavior for an off-patent, substitution-heavy bile acid sequestrant category. FDA labeling confirms the product type and therapeutic category but does not set pricing. [1]
Units: prices are expressed as USD per gram and USD per 30 days. Net price reflects typical payer contraction and rebate effects in a competitive generic market.
| Year | Scenario | Estimated net price (USD/gram) | Estimated net price (USD/30 days @ 8 g/day) | Estimated net price (USD/30 days @ 12 g/day) |
|---|---|---|---|---|
| 2026 | Baseline | 0.14 - 0.20 | 33 - 48 | 50 - 72 |
| 2026 | Downside (more competition) | 0.12 - 0.17 | 29 - 41 | 43 - 62 |
| 2026 | Upside (brief supply tightness) | 0.17 - 0.26 | 41 - 62 | 62 - 93 |
| 2027 | Baseline | 0.13 - 0.19 | 31 - 46 | 47 - 69 |
| 2027 | Downside | 0.11 - 0.16 | 26 - 38 | 40 - 57 |
| 2027 | Upside | 0.16 - 0.25 | 38 - 60 | 57 - 90 |
| 2028 | Baseline | 0.12 - 0.18 | 29 - 43 | 43 - 65 |
| 2028 | Downside | 0.10 - 0.15 | 24 - 36 | 36 - 54 |
| 2028 | Upside | 0.15 - 0.24 | 36 - 58 | 54 - 87 |
| 2029 | Baseline | 0.11 - 0.17 | 26 - 41 | 40 - 61 |
| 2029 | Downside | 0.09 - 0.14 | 22 - 33 | 33 - 50 |
| 2029 | Upside | 0.14 - 0.23 | 34 - 55 | 51 - 83 |
| 2030 | Baseline | 0.11 - 0.16 | 26 - 39 | 39 - 59 |
| 2030 | Downside | 0.09 - 0.13 | 21 - 31 | 32 - 47 |
| 2030 | Upside | 0.13 - 0.22 | 31 - 53 | 47 - 79 |
| 2031 | Baseline | 0.10 - 0.15 | 24 - 36 | 36 - 54 |
| 2031 | Downside | 0.08 - 0.12 | 19 - 29 | 29 - 43 |
| 2031 | Upside | 0.12 - 0.21 | 28 - 50 | 43 - 75 |
How should buyers interpret these bands?
- Baseline erosion reflects ongoing generic substitution and contracting.
- Downside reflects additional entrants, aggressive PBM contracting, and wider availability.
- Upside corresponds to periodic supply constraints and temporary contracting disruptions.
For procurement, the practical takeaway is that the category behaves like a low-single-digit-to-mid-single-digit annual net price downtrend with intermittent deviations.
Market Dynamics That Matter for 2026-2031
What are the key demand drivers?
- Stable chronic usage for bile acid diarrhea creates baseline demand.
- Lipid-lowering role persists under intolerance pathways and in specific step-therapy constructs.
- Formulary retention is the main lever, not new prescribing volume from breakthrough innovation.
What are the key supply and operational risk points?
Cholestyramine is sensitive to:
- manufacturing line constraints,
- raw material sourcing and polymer/resin supply,
- packaging availability (especially if shifting from bulk to convenient single-dose formats),
- and regulatory or quality events that can tighten supply and lift street pricing temporarily.
In commodity generics, supply tightness has an outsized short-term impact, but it typically normalizes when capacity returns.
How do payer and contracting dynamics shape realized price?
- PBM contracting can compress net price quickly, even without a change in WAC.
- National and regional formulary decisions determine switching speed.
- Patient out-of-pocket pressure in high coinsurance plans can shift volume toward the lowest-cost equivalent.
Commercial Strategy Implications (Actionable for R&D and Investment)
If you are evaluating entry or expansion, what matters most?
For a new entrant or an existing manufacturer seeking share in cholestyramine powder, the highest-leverage levers are:
- deliverable supply (avoid allocation and downtime),
- contract-ready net pricing aligned with PBM rebate structures,
- pack optimization to minimize dosing friction (unit economics per gram matter),
- and distribution breadth that supports consistent substitution behavior.
If you are forecasting revenue, what operating model should you use?
Use a three-layer forecast:
- Volume: assume modest growth (or flat-to-slightly declining) driven by stable indications offset by lipid displacement.
- Price: apply baseline net price erosion (mid-single-digit annual decline in net band center).
- Mix: account for shifts between bulk powder and more convenient formats.
If you are planning capacity, what is the risk framework?
- Plan for price erosion and contracting intensity as the default path.
- Assume supply issues can create brief upside, but normalize planning margins quickly.
- Stress test margins under downside net bands (table above).
Key Takeaways
- Cholestyramine powder is a mature, generic-dominant category with limited pricing power and demand anchored by bile acid diarrhea plus niche dyslipidemia pathways. [1]
- Net price is projected to trend downward from 2026 through 2031 under baseline conditions, with annual erosion driven by substitution and PBM contracting.
- Scenario ranges show typical annual price movement bands of low-single-digit to mid-single-digit net decline in the baseline, with temporary supply-driven upside and accelerated downside if competition intensifies.
- Procurement and revenue forecasts should model cost on a per-gram basis and translate into per-30-day spend for 8 g/day and 12 g/day cases as decision anchors.
FAQs
1) What is the dominant pricing pressure for cholestyramine powder?
Generic substitution and PBM contracting compress net pricing; realized net price typically declines over time unless supply tightness or contracting disruption occurs.
2) What drives demand more: dyslipidemia or bile acid diarrhea?
Bile acid diarrhea is usually the more stable chronic demand pool; dyslipidemia demand is more sensitive to lipid therapy displacement.
3) How should cost be modeled for budget impact analyses?
Model using grams per day and pack price to compute per-30-day and annual costs; use both 8 g/day and 12 g/day cases to bracket outcomes.
4) What scenario most often explains short-term price spikes?
Supply constraints and temporary allocation events, followed by normalization when capacity returns.
5) Is growth expected to come from new clinical adoption?
In a mature off-patent category, growth is more likely from formulary placement and patient switching mechanics than from breakthrough adoption.
References
[1] U.S. Food and Drug Administration. (n.d.). Drug Labeling (cholestyramine-containing products). FDA. https://www.accessdata.fda.gov/scripts/cder/daf/index.cfm
More… ↓
